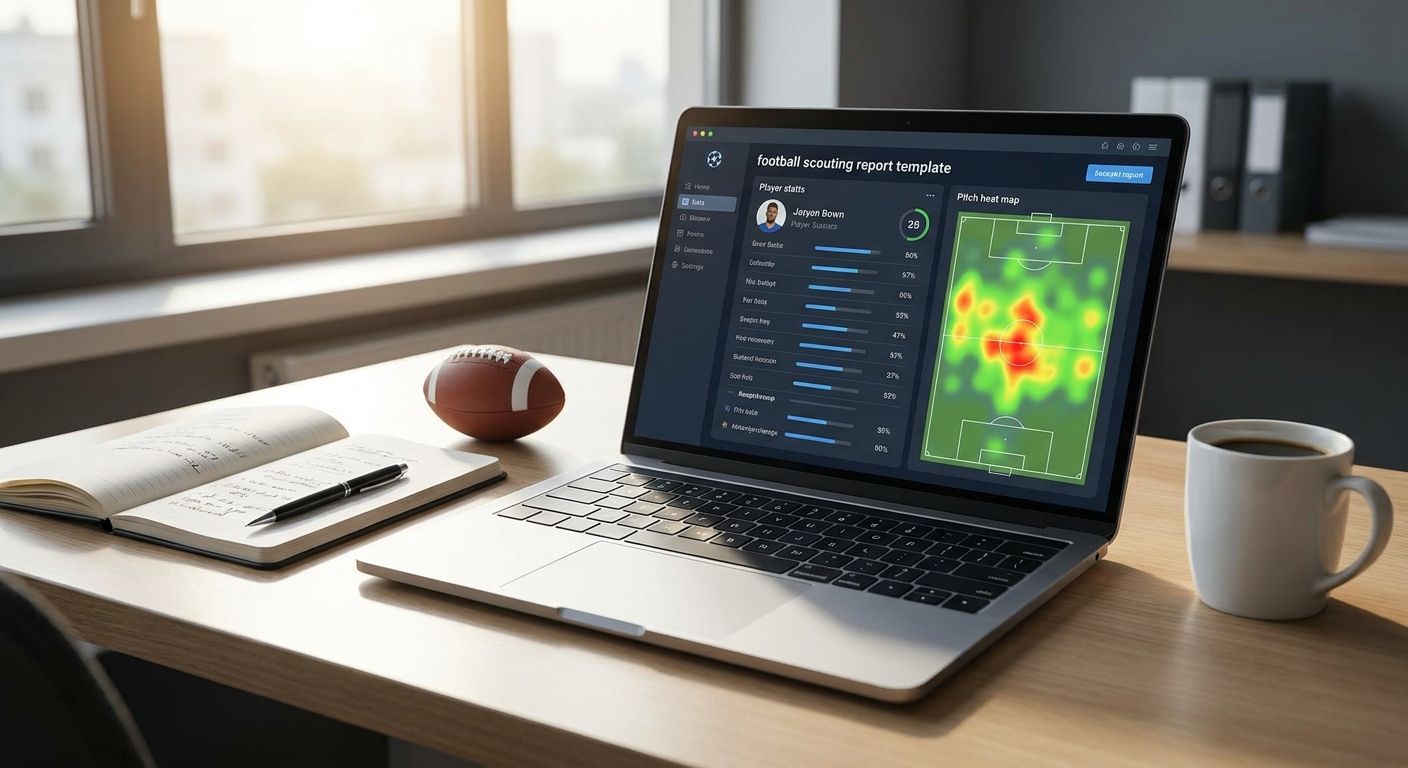
Scouting reports built on raw stat tables get skimmed and forgotten. A radar chart for football scouting turns a player's numbers into one shape a recruitment meeting can argue about in under a minute — but only if the underlying data is built correctly.
- A radar chart for football scouting only works with percentile data inside a matched positional population — raw per-90 numbers distort the shape.
- FBPlot covers 107+ leagues in 2026, with the Top 5 European leagues free and full competition access on the Pro plan.
- Premier League and Bundesliga comparison pages are the safest starting point for scouts working single-league shortlists in 2026.
- Cross-league radar charts need adjustment for competition strength before they go in front of a recruitment director.
- Skip any radar built on fewer than 900 minutes — the shape looks confident and the sample isn't.
Why this matters
A scout who hands over a bar chart gets a nod. A scout who hands over a radar chart for football scouting gets a follow-up question — because the shape invites comparison against a template the room already recognizes. That's the entire value: pattern recognition happens faster on a radar than on a spreadsheet.
The risk runs the other way too. A radar built on the wrong population, with raw per-90 values instead of percentiles, or on a sample under a few hundred minutes, looks exactly as confident as a correct one. Nobody in the room can tell the difference just by looking at it, which is why the build criteria below matter more than the chart software itself.
Who this is for
This guide is for club scouts, recruitment analysts, and independent scouting content creators who need to turn player data into a shareable radar chart for a report, a Twitter thread, or a recruitment meeting in 2026 — not for casual fans who just want a pretty picture. If you're building shortlists or defending a signing recommendation, the criteria below decide whether your chart survives scrutiny. FBPlot builds these radars from data across 107+ leagues, which matters once you're comparing beyond your own domestic competition.
What to look for in a radar chart for football scouting
Matched positional population
A radar comparing a No.6 against a general midfield population will always flatter passing volume and understate defensive actions. Build the radar against players who share the actual role, not just the position label on a team sheet.
Percentile scaling, not raw per-90
Raw per-90 numbers make high-possession teams look inflated across every metric on the radar. Percentile scaling against the matched population is what makes the shape mean something comparable across clubs.
A stated minutes cutoff
A radar built on 400 minutes swings wildly with the next three matches. Set a cutoff — 900 minutes is a reasonable floor for outfield players in-season — and note it on the chart.
League-strength context
A 90th-percentile shot-creating action rate in one league isn't the same signal in a stronger one. Any cross-league radar needs a note on competition strength or it invites a bad recommendation.
Metric selection tied to role, not vanity stats
Progressive passes matter for a deep-lying playmaker; they say little about a poacher. Pick five to eight metrics that describe the job, not the metrics that happen to be available.
A caption that can be reproduced
If someone else can't rebuild your radar from the caption — population, cutoff, season, metrics — it isn't a scouting document, it's a graphic. Document it the way you'd document any reproducible chart.
Where radar charts for scouting actually hold up
The high-competition pick — Premier League radar builds. Twenty clubs, dense data coverage, and a recruitment audience that already reads this league's numbers fluently. Building a Premier League player comparison radar is the fastest way to get a shortlist taken seriously in 2026. One spec that matters: with 20 clubs and roughly 38 matches each, the positional samples are large enough to hit a 900-minute cutoff by mid-season. Verdict: Buy.
The cross-league pick — comparing players from different competitions. The wildcard, because it's the one radar type most likely to mislead if you skip the league-strength adjustment. A properly built cross-league player comparison radar is still the only honest way to shortlist a target from a smaller league against a Top 5 incumbent. One number that matters here: FBPlot's free tier only covers the Top 5 leagues, so cross-league radars involving the other 100+ competitions in its coverage need the Pro plan. Verdict: Consider — only once you've documented the league-strength adjustment in the caption.
The underrated pick — Bundesliga radar builds. Bundesliga data is dense on pressing and transition metrics, which most radar templates undersell in favor of passing volume. A Bundesliga player comparison radar built around defensive actions and progressive carries surfaces profiles that a generic template misses entirely. Verdict: Buy for any scout targeting pressing-heavy profiles.
Build your first scouting radar
Chart Top 5 league data free, or unlock all 107+ competitions on Pro.
What to avoid
- A radar built from season-long raw totals. It rewards players who simply played more minutes, not players who performed better per minute.
- A radar mixing two roles under one label. A "midfielder" radar blending a No.6 and a No.10 population produces a shape that fits neither player.
- A radar with no season or cutoff stated. Without that, nobody reviewing it in 2026 can tell if the data is from August or from a full campaign.
Verdict comparison
| Pick | Best for | Sample check | Verdict |
|---|---|---|---|
| Premier League radar | Domestic shortlist, board-ready | 900+ min by mid-season across 20 clubs | Buy |
| Cross-league radar | Smaller-league signings vs. Top 5 incumbents | Needs league-strength adjustment | Consider |
| Bundesliga radar | Pressing/transition profiles | Strong defensive-action data density | Buy |
FAQ
What's the best radar chart for football scouting in 2026?
The best radar chart for football scouting in 2026 is one built on percentile data against a matched positional population with a stated minutes cutoff. Without those three elements, the visual style doesn't matter — the comparison is unreliable.
Is a radar chart better than a pizza chart for scouting?
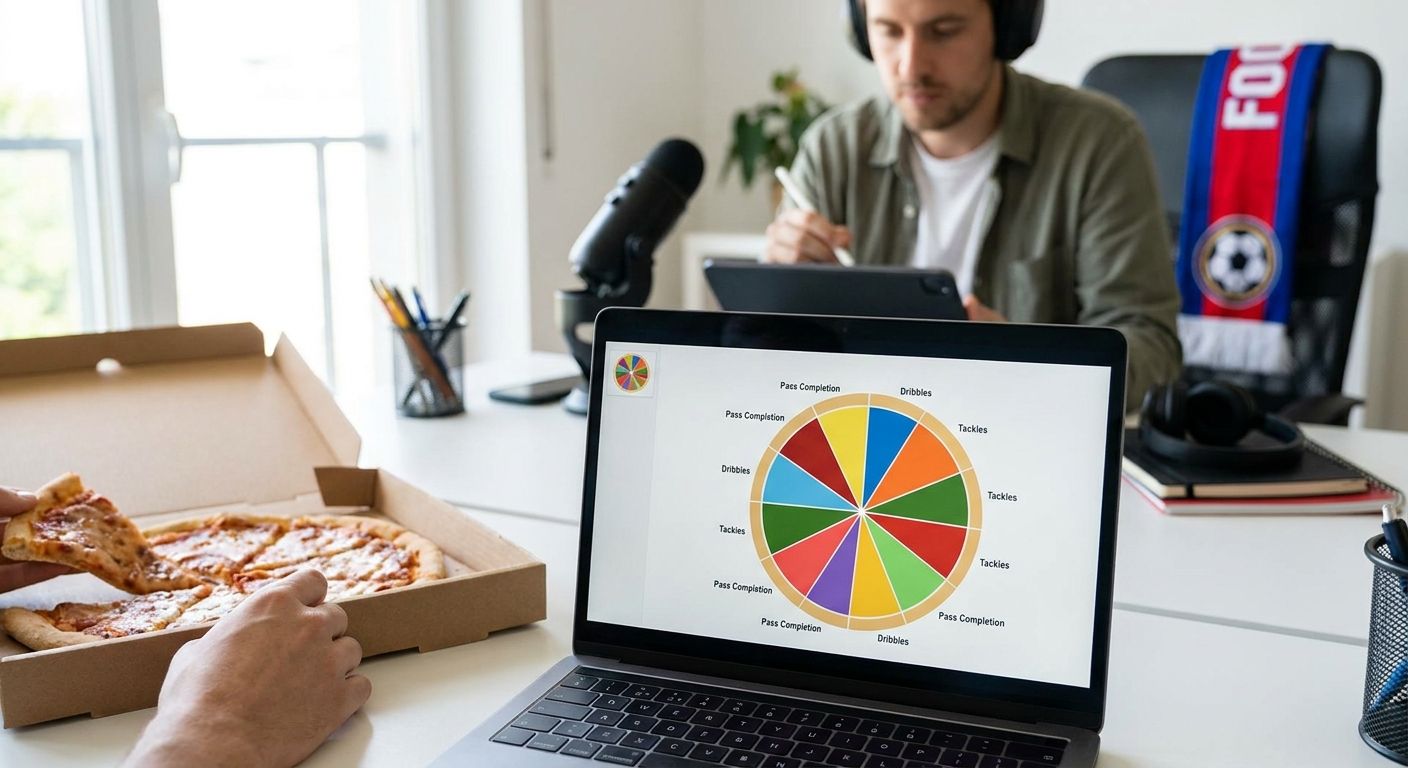
A radar chart and a pizza chart plot the same percentile data differently, so neither is inherently better for scouting. Pizza charts read faster in a quick share; radars read faster when overlaying two players directly.
How much data does a radar chart need to be reliable?
A 900-minute floor is a reasonable in-season cutoff for outfield players before the shape stabilizes. Below that, a hot streak or a slump can swing the radar without reflecting the player's real level.
Can you compare players from different leagues on one radar?
Yes, but only after adjusting for league strength, since a 90th-percentile rate in a weaker league isn't equivalent to the same percentile in a stronger one. FBPlot's cross-league comparison guide walks through the adjustment.
Does FBPlot cover leagues outside the Top 5?
Yes, FBPlot covers 107+ leagues as of 2026, with the Top 5 European leagues available on the free tier and the rest unlocked on the Pro plan.
What metrics should go on a scouting radar?
Pick five to eight metrics tied to the player's actual role rather than whichever stats are easiest to pull. A No.6 radar should lean on defensive actions and progressive passes, not shot-creating actions.
How often should a scouting radar be updated?
Update it whenever the sample crosses a meaningful threshold, such as a new month of matches or a change in role. A radar built in August 2026 and still used unchanged in March 2026 is stale.
One last thing
The radar that gets challenged in a recruitment meeting is rarely the one with the wrong metrics — it's the one where nobody can say what the cutoff date or minutes floor was. Write that detail into the caption before you share the chart, not after someone asks.