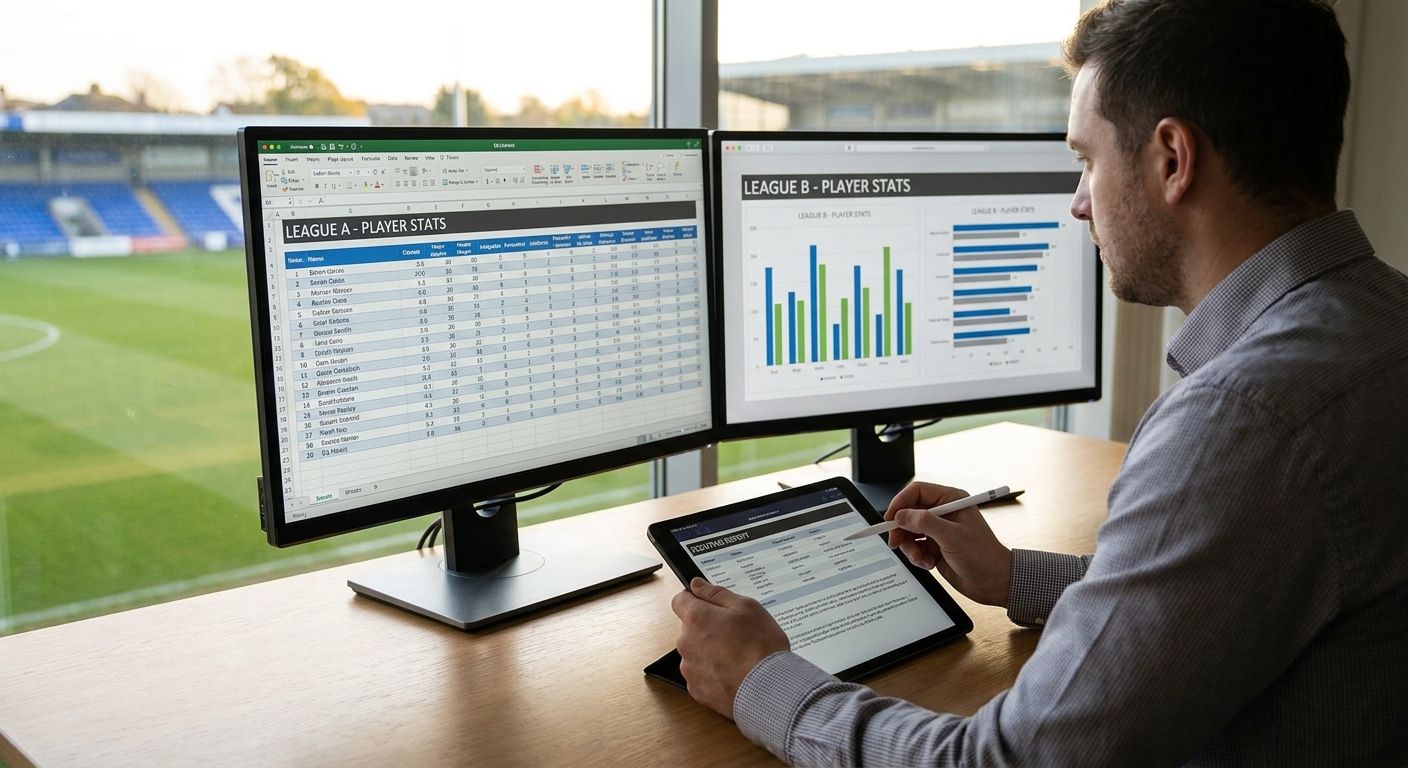
Comparing a Serie A striker to a Bundesliga winger by raw goals and assists tells you almost nothing about who's actually better — league pace, squad strength, and role all distort the numbers before you've even opened a chart.
- Raw totals mislead when you compare players different leagues — always convert to per-90 or percentile metrics first.
- Set a shared minutes cutoff (analysts commonly use 900+ minutes) before ranking anyone across competitions in 2026.
- League strength context matters more than the metric itself: a Ligue 1 forward's per-90 output isn't a Premier League forward's per-90 output.
- FBPlot's percentile radar and pizza charts normalize scale across 107+ leagues so the comparison is visual, not just spreadsheet math.
Why this matters
Every cross-league comparison that goes viral for the wrong reasons made the same mistake: someone put two players' raw stats side by side without adjusting for minutes, role, or competition strength. A midfielder who played 3,400 minutes in a slow, low-press league will out-tackle a midfielder who played 1,800 minutes in a high-intensity one — not because he's better, but because he had more opportunities in an easier context.
Getting this right isn't about finding a magic formula. It's about applying the same discipline scouts and analysts use before any number goes on a chart: define the population, normalize the sample, and be honest about what the data can and can't say. Do that, and comparing players across leagues becomes a defensible exercise instead of a Twitter argument.
What you'll need
- A player-level data source with per-90 or percentile stats already available (raw totals alone won't cut it)
- A defined metric set relevant to the role you're evaluating (progressive passes and xG for attackers, tackles won and pressures for defensive midfielders)
- A minutes or matches cutoff applied consistently to both players
- Context on league strength — not every competition produces stats at the same rate
- A charting tool built for player data, like FBPlot, which converts stats into radar, pizza, and scatter charts with percentile scaling built in
The steps
1. Define the question and the population
Before touching a single number, write down exactly what you're trying to answer: "Is Player A a better progressive carrier than Player B?" not "Who's better?" A vague question produces a vague, defensible-nowhere comparison. Name the position, the role within that position, and the competitions both players featured in during the period you're checking.
Common mistake: skipping this step and jumping straight to a radar chart. If you can't state the question in one sentence, the chart won't answer it either.
2. Convert everything to per-90 (or percentile) metrics
Raw totals reward playing time, not quality. A player with 2,900 minutes will always out-total a player with 1,600 minutes on cumulative stats like tackles or key passes, regardless of who's sharper per touch. Convert every metric to a per-90 basis, or better, to percentile rank within a relevant positional sample, before you compare players from different leagues.
This single step fixes more bad comparisons than any other adjustment on this list.
3. Set a shared minutes cutoff before you compare
Small samples swing wildly — a player on 400 minutes can post an inflated per-90 number off two hot games. Analysts commonly use a floor around 900 minutes (roughly ten full matches) before trusting a per-90 rate as stable. Apply the same cutoff to both players. If one clears it and the other doesn't, say so explicitly rather than comparing anyway.
Expected outcome: you either have two comparable samples or a documented reason the comparison is provisional.
4. Adjust for league strength context
This is the step most casual comparisons skip entirely. A striker's per-90 xG in a competition with less structured defensive lines will run higher than the same skill level would produce in a tighter, more organized league. You don't need a proprietary strength model to account for this — flag the leagues involved, note the general competitive tier, and read the raw percentile gap with that caveat attached rather than treating it as settled fact.
5. Normalize position and role, not just position label
"Winger" means different things in a 4-3-3 built to isolate one-on-ones versus a 4-2-3-1 where the wide player tucks inside constantly. Match players by functional role — who they actually do on the pitch — not the label on the team sheet. A wide forward compared against an inverted winger on the same radar template will produce numbers that look wrong because the roles were never equivalent.
6. Build the chart on a shared scale
Once your metrics, cutoff, and role match are locked, build the actual visual. Use the same metric set, the same percentile population, and the same scale for both players — never let one player's chart use a different comparison group than the other's. FBPlot's radar and pizza charts handle this scaling automatically once you select a comparable positional sample, which removes the manual axis-matching that causes most self-built spreadsheet charts to mislead.
7. Add a short context caption
Write one line under the chart stating the sample: minutes cutoff, season, competitions, and position group used. This single sentence is what separates a chart someone can cite from one they should ignore. If you're building this for a report rather than a social post, the caption is non-negotiable.
8. Sanity-check the outlier
Before publishing or sharing, look at whichever metric shows the biggest gap between the two players and ask why. If it's driven by three matches, a red card absence, or a tactical change mid-season, flag it. Common mistake: treating every percentile spike as a talent signal instead of checking if it's a sample artifact first.
Build the comparison chart now
Percentile radar and pizza charts across 107+ leagues, free for the Top 5.
Troubleshooting
The data providers define the same metric differently. Progressive passes, pressures, and even "key passes" vary slightly by source. Stick to one provider for both players in a single comparison — mixing sources introduces error before you've adjusted for anything else.
One player clears the minutes cutoff, the other doesn't. Don't lower the bar to force a comparison. Either wait for more matches or label the comparison as provisional in your caption.
League strength isn't accounted for and the gap looks too large to be real. That's usually the tell that competition context, not talent, is driving the number. Note it rather than deleting the finding.
Position labels match but roles don't. If the radar looks lopsided in a way that contradicts what you've watched on the pitch, check whether both players are actually doing the same job for their teams.
Season length differs across competitions. Some leagues play 34 games, others 38 — per-90 rates fix most of this, but total-season sums still won't be directly comparable.
Lower-tier or non-Top-5 league data is sparse. Coverage thins out fast below the biggest competitions. Confirm the sample size is real before trusting a percentile from a smaller league.
Tools and resources
- A per-90 or percentile-ready data source for both players' competitions
- A documented minutes cutoff, applied the same way to each player
- FBPlot for building the actual radar, pizza, or scatter chart once the data is clean
- League-specific side-by-side guides if you're staying within one competition first: Premier League player comparisons, La Liga player comparisons, and Serie A player comparisons
“If the minutes cutoff isn't the same for both players, the comparison isn't finished yet.”
What to do next
Once you're comfortable comparing across leagues, the next skill is documenting the method so someone else can reproduce it — a reviewer, an editor, or your own future self six months later. That's a separate discipline from the chart itself, and it's the difference between a finding people cite and one they question. Check the Bundesliga player comparison guide for a worked single-league example before scaling the same method across competitions.
FAQ
What's the best way to compare players from different leagues fairly in 2026?
Convert stats to per-90 or percentile metrics, apply the same minutes cutoff to both players, and account for league strength before comparing. Raw totals alone will always favor the player with more minutes or the easier competition.
Is per-90 data better than raw totals for cross-league comparisons?
Yes, per-90 data removes the bias caused by different playing time. A player with 1,600 minutes and a player with 3,000 minutes can't be compared fairly on raw totals, but their per-90 rates can.
How many minutes do you need before trusting a player's stats?
Many analysts use a floor around 900 minutes, roughly ten full matches, before treating per-90 numbers as stable. Below that, small-sample noise can inflate or deflate a rate significantly.
Does league strength actually affect player stats?
Yes, competitive tier affects how easily a player accumulates stats like goals, tackles, or progressive passes. The same skill level can produce different per-90 numbers depending on the league's defensive structure and pace.
Can you compare players in different positions across leagues?
Only if you match them by functional role, not just position label. Two players both labeled 'winger' can have completely different jobs on the pitch, which makes a direct radar comparison misleading.
What's the difference between a radar chart and a pizza chart for comparing players?
A radar chart plots multiple metrics on connected axes to show a shape, while a pizza chart shows the same percentile data as wedge segments, which many readers find easier to scan quickly. Both need the same underlying population and cutoff to be valid.
How much does it cost to build cross-league comparison charts?
FBPlot's free tier covers chart-making for the Top 5 leagues, while the Pro plan unlocks all 107+ competitions for comparisons outside the biggest leagues.
Why do two players with similar raw stats look different on a percentile chart?
Percentile charts compare each player against a relevant positional population, so context like league strength and sample size changes the ranking even when raw numbers look close. This is usually the correct read, not an error.
One last thing
The single biggest fix in this entire process isn't a formula — it's writing down your minutes cutoff and population before you look at the chart. Analysts who decide the sample after seeing which player wins are the ones who get called out for cherry-picking. Lock the method first, then let the radar tell you what it tells you, even if it contradicts what you expected going into 2026's transfer window discussions.