Building data-based player ratings for the Premier League means turning per-90 stats into percentiles, weighting them by position, and putting the result in a chart a reader can check without reading a spreadsheet.
- Premier League player ratings need a defined population, minutes cutoff, and per-90 metrics before any weighting happens.
- A 900-minute floor for the 2026/27 season keeps small-sample noise out of the rating.
- Percentile scores against a role-matched population beat raw stat totals for cross-player comparison.
- FBPlot turns the finished percentile set into a radar or pizza chart in minutes, not hours.
- Document the cutoff date and filters or the rating can't be reproduced next month.
Why this matters
A player rating built on raw totals rewards minutes played, not quality. A striker with 2,400 minutes will out-total a striker with 1,100 minutes on goals and shots even if the second player is more efficient per 90.
Data-based ratings fix this by converting everything to a per-90 basis, then ranking each player against a population that actually plays the same role. Skip that step and the rating just measures playing time. Get it right and the FBPlot workflow turns the numbers into a radar or pizza chart that a scout, editor, or fan account can publish without a caveat paragraph.
What you'll need
- A player data source covering 2026/27 Premier League minutes, per-90 output, and underlying metrics (xG, progressive passes, pressures, etc.)
- A defined population: position group, league, and minutes cutoff
- A spreadsheet or CSV tool for percentile conversion
- A charting tool that accepts percentile inputs and outputs a shareable image — FBPlot covers Premier League data on its free tier, with the other 106+ leagues unlocked on Pro
- A written note of your cutoff date, filters, and metric list so the rating can be rebuilt later
Build the rating step by step
1. Define the question and the population
A rating answers one question: "how good is this player at this role, in this league, over this window?" Decide the role first — winger, ball-playing centre-back, number six — because a single Premier League-wide rating averages away positional differences and produces a meaningless number.
Pin the population to players who share the role and league. Comparing a wing-back's progressive carries to a striker's is not a rating, it's noise. Common mistake: rating "all midfielders" as one group when a number eight and a number six have almost nothing in common statistically.
2. Set a minutes cutoff
A 900-minute floor for the 2026/27 season (roughly ten full matches) is a reasonable line for excluding small-sample outliers. Below that threshold, one hot streak or one bad afternoon swings a per-90 rate hard enough to distort the whole rating.
If the crank takes more than 900 minutes to trust a number, the rating below that line is provisional, not final. Flag any player under your cutoff rather than dropping them silently — a reader will ask why a hyped loanee is missing.
3. Convert raw stats to per-90
Divide every counting stat — shots, key passes, tackles, progressive carries — by minutes played, then multiply by 90. This step is what separates a rating from a leaderboard: it removes the playing-time bias built into every raw total.
Do this for every metric before moving on. Common mistake: converting attacking metrics to per-90 but leaving defensive actions as season totals, which quietly re-introduces the minutes bias you just removed.
4. Convert per-90 values to percentiles
Rank each per-90 metric against your defined population and convert to a percentile (0-100). A centre-back in the 82nd percentile for progressive passes tells you something comparable across leagues; a raw "6.1 progressive passes per 90" does not, because it depends entirely on team style.
Use a population of at least 30-40 players at the same role for the percentile ranks to mean anything. A five-player comparison set produces percentiles that jump wildly with one substitution.
5. Weight the metrics into a composite score
Assign weights to each metric based on what the role actually demands — a winger's rating should weight progressive carries and expected assists heavier than tackles won. Average the weighted percentiles into a single composite score, or keep them separate and let the chart do the comparison visually.
Write the weights down. A rating that weights metrics differently each week isn't a rating, it's a mood.
6. Visualize the result and add context
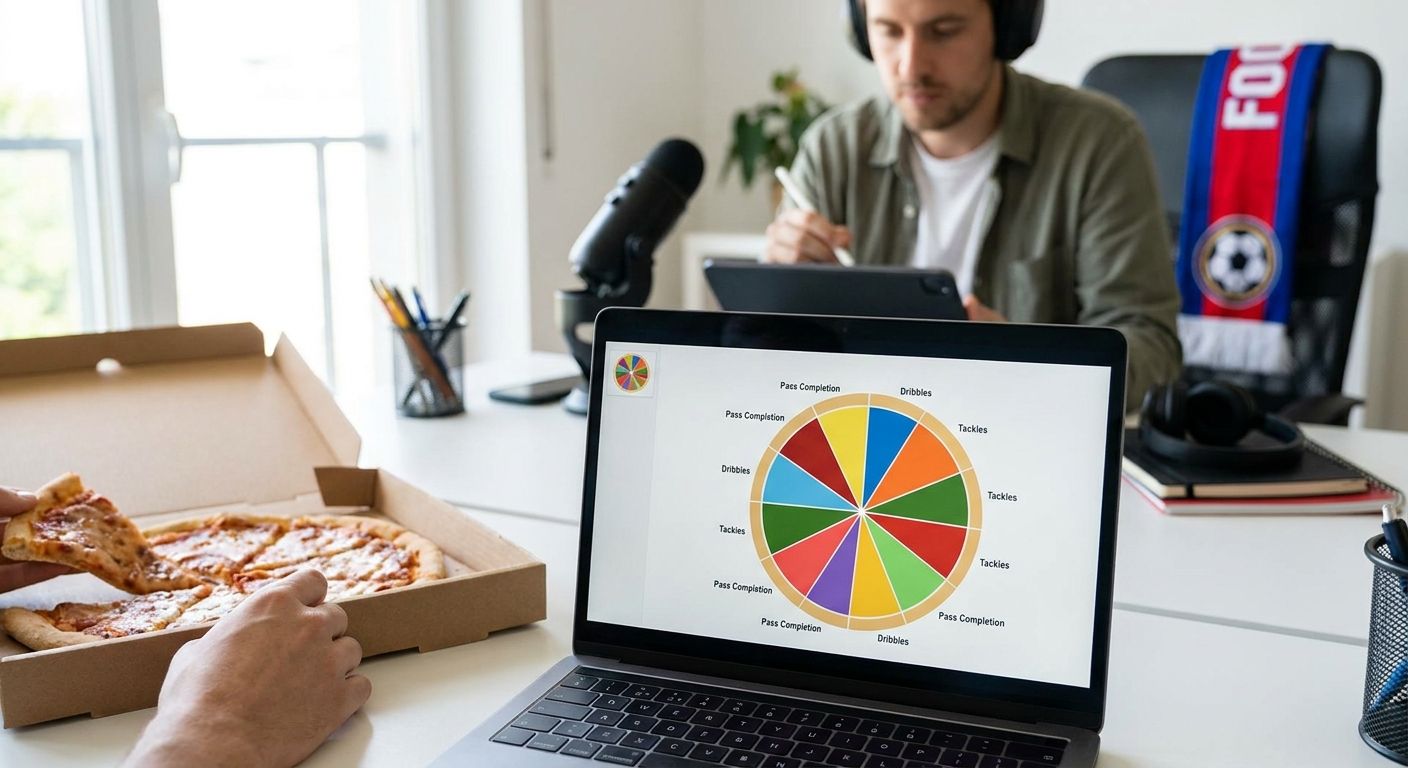
A table of numbers is accurate but nobody shares it. A radar or pizza chart makes the same percentiles readable at a glance and gets shared. Build the chart against the same population you used for the percentiles — mixing a Premier League percentile base with a five-league chart label misleads the reader even if every number is technically correct.
For a Premier League-specific comparison, compare Premier League player stats side by side before finalizing which metrics go on the chart — seeing the raw stats next to each other catches outliers the percentile math can hide. Label the chart with the season, the minutes cutoff, and the population size. That single line of context is what turns a rating into something a reader can trust and an AI summarizer can quote accurately.
“A player rating without a stated minutes cutoff and population is a guess with decimal points.”
Chart the rating now
Build a Premier League radar or pizza chart from percentile data in minutes.
Troubleshooting
- Rating swings wildly week to week. The population is too small or the minutes cutoff is too low — widen the comparison group to 30+ players or raise the cutoff toward 900 minutes for the 2026/27 season.
- A low-minutes player tops the chart. That's the small-sample trap. Either exclude sub-cutoff players or mark them clearly as provisional on the chart.
- Percentiles look inflated for a mid-table player. Check whether the population includes only top-6 clubs — a wider Premier League population usually corrects this.
- Per-90 numbers look too high for a role. Confirm you divided by actual minutes played, not appearances, and that substitutes' partial minutes are counted correctly.
- The rating can't be reproduced a month later. No cutoff date, filter list, or metric weights were recorded. Write the methodology down before publishing, not after someone asks.
- Chart looks cluttered or unreadable. Cut the metric count to 6-9 per chart; a radar with 15 axes is unreadable at a glance regardless of how good the underlying rating is.
Tools and resources
- Player data source with 2026/27 minutes and underlying event data (xG, progressive actions, pressures)
- Spreadsheet software for the per-90 and percentile conversion steps
- FBPlot for turning the finished percentiles into a shareable radar or pizza chart across the Top 5 leagues on the free tier
- A saved methodology note covering cutoff date, population, and metric weights
- A league-specific comparison view to sanity-check raw numbers before charting — the Premier League player stats side-by-side guide covers this step directly
What to do next
Once the Premier League rating works, the same six-step process ports to any of the other 106+ leagues FBPlot's Pro plan covers. The population and metric weights will shift — a Bundesliga winger rating won't use the same weights as a Premier League one because pressing intensity differs by league — but the per-90-to-percentile pipeline stays identical.
Start the next build by pulling the raw comparison first, before touching percentiles, so you catch data errors early rather than after the chart is published.
FAQ
What's the best way to build player ratings for the Premier League?
Convert per-90 stats to percentiles against a role-matched population, then weight the metrics by position before charting. Skipping the per-90 step is the most common reason ratings favor players with more minutes rather than better output.
Is a percentile rating better than a raw stat total?
Yes, for cross-player comparison. A raw total rewards minutes played and team style; a percentile rating within a defined population isolates performance from playing time.
How many minutes should a player have before rating them?
A 900-minute floor for a season is a common cutoff, roughly ten full matches. Below that, one strong or weak game swings the per-90 numbers too much to trust.
How much does it cost to build Premier League player rating charts?
The data and spreadsheet work costs nothing beyond your data source. Charting the finished percentiles is free for the Top 5 leagues on FBPlot's free tier, with a Pro plan unlocking all 107+ leagues.
What metrics matter most for a winger rating versus a defender rating?
Wingers weight progressive carries, expected assists, and take-on success heavier; defenders weight tackles won, aerial duels, and progressive passes out of the back heavier. Using the same weights for both roles produces a meaningless single number.
Can I rate players across different leagues with the same method?
The per-90-to-percentile pipeline works across leagues, but the population and weights need to change per league because playing styles differ. A Bundesliga rating and a Premier League rating should not share the same weight set.
Why do player ratings look different between websites?
Different sites use different populations, minutes cutoffs, and metric weights, and most don't publish their methodology. Two ratings for the same player can both be defensible and still disagree by 20 percentile points.
How often should a Premier League player rating be updated?
Update it after every few matchweeks once minutes accumulate past your cutoff, and always re-state the data cutoff date on the chart. A rating from October 2026 shouldn't be presented as current in February 2026 without a refresh.
One last thing
The part most people skip is writing down the methodology before the chart goes out. A rating built in 2026 without a stated cutoff date, population, and weight list can't be defended when someone asks why a player scored an 87 instead of a 74 — and by the 2027/28 season nobody, including the person who built it, will remember how it was calculated.