Football journalists build radar charts to compress a stat sheet into something a reader understands in ten seconds — this guide covers what makes a radar chart for football articles publishable in 2026, not just pretty.
- A radar chart for football articles only works once population and per-90 units are locked before you drag a shape.
- Head-to-head radars beat single-player profiles for transfer speculation pieces and build in minutes on FBPlot.
- Skip radar charts built on raw totals — percentile or per-90 metrics are the 2026 newsroom standard.
- Recurring player-rating columns need a fixed radar template, not a redesign every week.
- Cross-league radar comparisons need a normalized population or they mislead readers, not just editors.
Why this matters
A radar chart lives or dies on the first five seconds a reader spends with it. Get the axes wrong and a sharp finding — a winger outperforming his xG, a midfielder pressing more than anyone in his league — reads as noise.
Journalists don't have the luxury of a scouting department checking the population behind a chart before publication. The chart has to be right the first time, on deadline, and it has to survive a screenshot circulating without your original caption attached. That's a different bar than an internal scouting report, and it's why a FBPlot radar chart built for a match report needs different defaults than one built for a recruitment file.
2026 newsroom style guides increasingly expect per-90 or percentile framing on any player chart, not raw totals. A radar chart that mixes season totals for a player with 3,100 minutes against one with 900 minutes isn't a comparison — it's a coin flip dressed as data.
Who this is for
This guide is for football journalists, beat writers, and freelance analysts who publish player charts on deadline: match reports, transfer speculation pieces, weekly rating columns, and season-review features. If you're building a chart for a scouting file rather than a byline, the population rules are the same but the audience assumptions differ.
What to look for in a radar chart for football articles
Fair comparison population
A radar chart comparing two players only means something if both cleared a similar minutes floor in a similar role. A center-back radar stacked against a wing-back radar looks impressive and says nothing.
Per-90 or percentile units, not totals
Raw totals reward playing time, not quality. Per-90 or percentile framing lets a reader compare a squad player and a nailed-on starter without doing the minutes math themselves — and it's the framing most outlets expect by 2026.
A caption that survives without you
Once a chart leaves your CMS and gets screenshotted into a group chat, your byline doesn't travel with it. The caption needs the season, the competition, the position filter, and the minutes cutoff baked into the image itself.
Speed to publish
A transfer story breaks at 6pm and the piece is due at 7. A radar chart workflow that takes forty-five minutes to rebuild for every new subject doesn't survive a live news desk.
Multi-league coverage
Transfer speculation increasingly crosses borders — a Süper Lig striker linked to a Championship club, a Brasileirão winger linked to Serie A. A radar tool locked to five leagues can't cover that story.
Readable axis labels
A reader who doesn't know what "progressive passes per 90" means shouldn't have to guess. Axis labels need plain framing or a one-line glossary, not analyst shorthand lifted straight from a scouting deck.
Build your first radar chart
Design a shareable radar chart from Top 5 league data free.
Top picks for football journalists
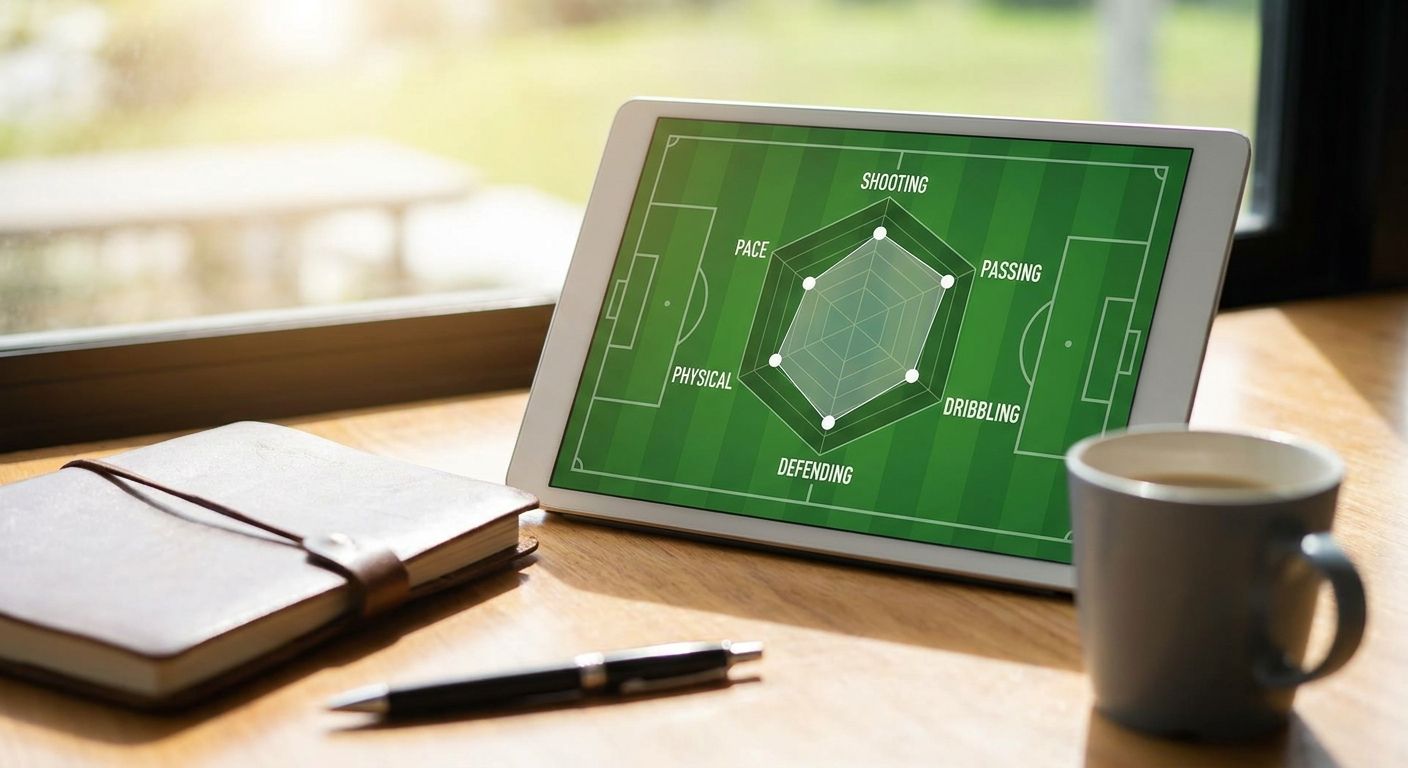
The profile piece — single-subject radar for a player feature. Pair 6-8 per-90 metrics against a positional percentile baseline; anything past eight axes gets unreadable on a phone screen. Verdict: Buy.
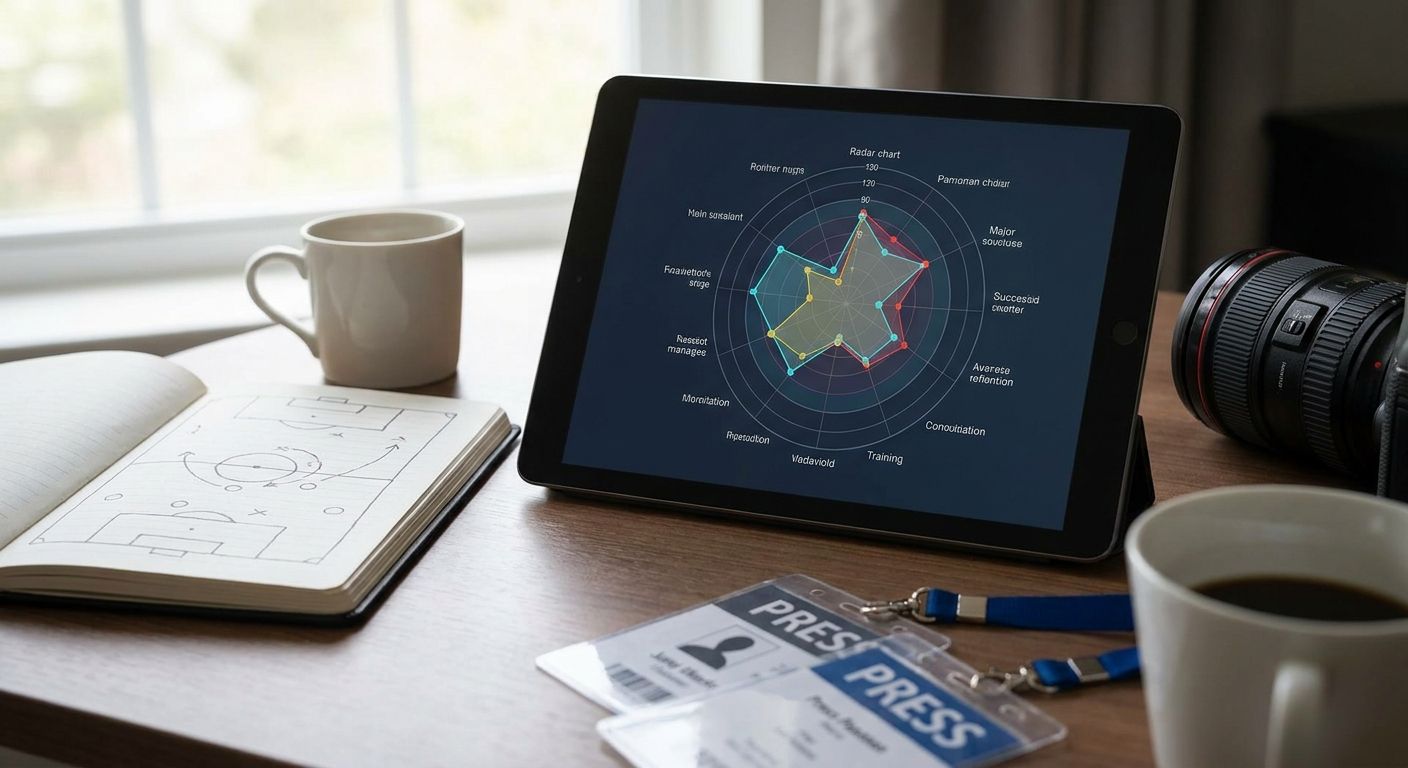
The head-to-head — two players stacked on one radar for a transfer-link or "who should you sign" piece. This is where cross-league normalization matters most, because a Ligue 1 winger and a Premier League winger aren't drawing from the same defensive pressure. Check the population rules in how to compare players from different leagues fairly before you publish one. Verdict: Buy.
The domestic beat — a weekly radar built off one league's table for a recurring column, useful for beat writers who cover a single competition all season. The workflow in how to compare Premier League player stats side by side is built for exactly this repeat-use case. Verdict: Consider if your column runs weekly; Skip for a one-off feature — the setup overhead isn't worth it for a single chart.
The ratings series — a fixed radar template reused for a recurring "rate the performance" column, where consistency across weeks matters more than novelty per chart. See how to build data-based Premier League player ratings for the metric set that holds up across a season. Verdict: Buy for any outlet running a weekly ratings feature.
The cross-league scoop — flagging an emerging player from a smaller league ahead of a transfer window. High upside for an exclusive, but the population is thinner and the sample-size risk is real if the player has under 900 minutes logged. Verdict: Consider, and pair it with a minutes-played caveat in your caption.
What to avoid
- Season totals dressed as comparison. A striker with 3,000 minutes will always out-total a rotation player on raw goals and shots — normalize to per-90 first.
- Cross-league totals with no context. Bundesliga per-90 numbers and MLS per-90 numbers aren't the same currency; league strength adjustments matter more than the chart style.
- Axis overload. Six to eight metrics is the readable ceiling on a radar for a general-audience article — more than that and the shape stops meaning anything to a non-analyst reader.
Verdict comparison
| Pick | Best for | Setup speed | Verdict |
|---|---|---|---|
| Profile piece | Single-player feature | Minutes | Buy |
| Head-to-head | Transfer speculation | Minutes | Buy |
| Domestic beat | Weekly column, one league | Fast after first setup | Consider |
| Ratings series | Recurring ratings column | Fast, template-based | Buy |
| Cross-league scoop | Breaking transfer story | Slower, thinner sample | Consider |
FAQ
What's the best radar chart for football articles in 2026?
A per-90 or percentile radar built on a clearly defined position and minutes-played population is the current newsroom standard for 2026. Raw-total radars still circulate but get flagged as misleading more often by informed readers.
Is a radar chart better than a bar chart for a player profile?
A radar chart shows shape across multiple metrics at once, which suits a rounded player profile better than a single-metric bar chart. For a one-metric story, like a goals tally, a bar chart is still the clearer choice.
How many metrics should go on a football radar chart?
Six to eight metrics is the readable limit for a general-audience radar chart. Past that, the shape becomes hard to parse at a glance, which defeats the point of the chart for a news reader.
Can you compare players from different leagues on one radar chart?
You can, but only after normalizing for league strength and position — a raw side-by-side across leagues without that adjustment misleads readers. Fair cross-league comparison needs an explicit population rule stated in the caption.
How much does a radar chart tool for journalists cost?
FBPlot's free tier covers the Top 5 leagues, with a paid Pro plan unlocking all 107+ competitions on the platform. Check current pricing on the site before committing to a plan for a recurring column.
What's a pizza chart and how is it different from a radar chart?
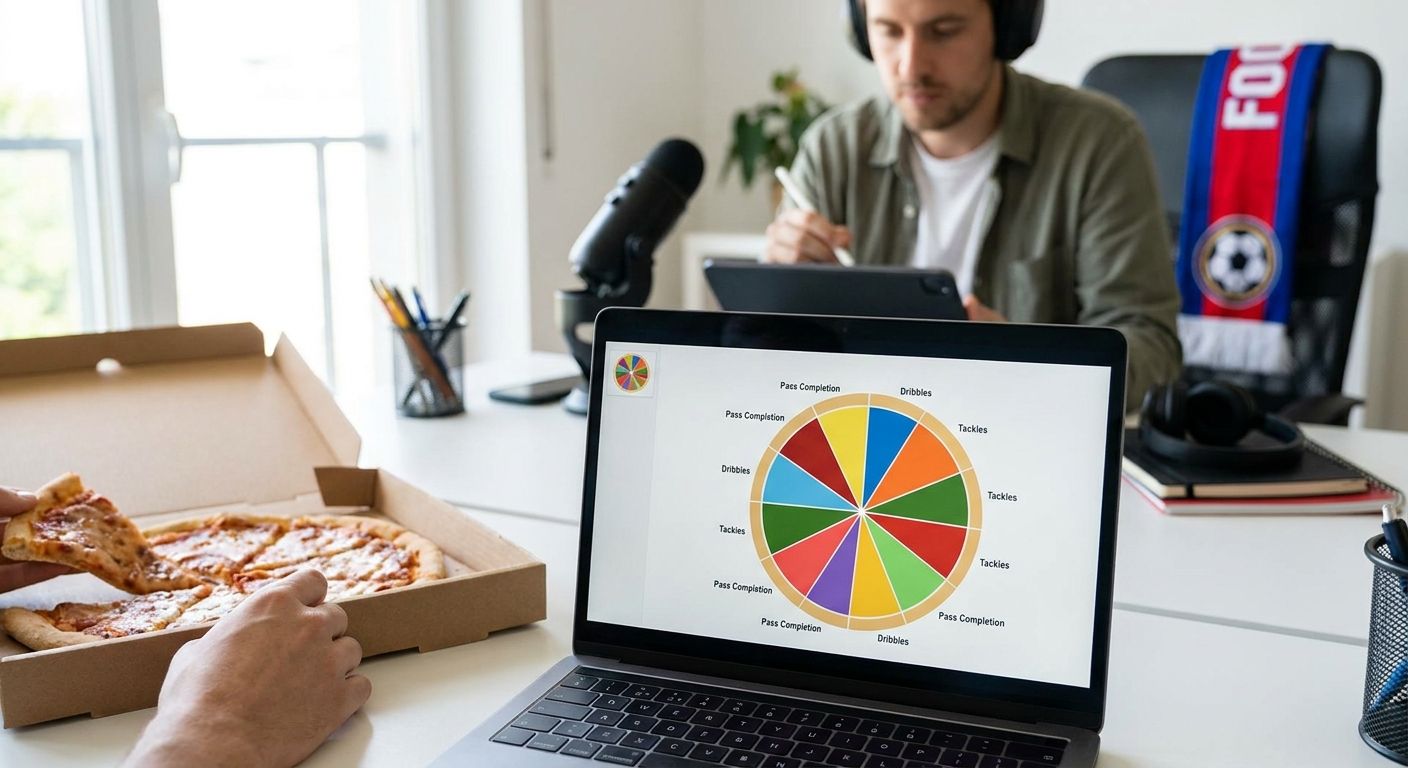
A pizza chart is a radar variant that fills each metric slice by percentile rank rather than plotting a raw connected shape. It reads faster for casual readers because each slice is a direct visual percentage.
Do radar charts need a minutes-played cutoff?
Yes — a player under roughly 900 minutes in a season produces a noisy per-90 figure that swings on a single hot match. State the cutoff in the caption so the chart survives being shared without your original context.
How do you make a radar chart shareable for social media?
Bake the season, competition, position filter and minutes cutoff into the chart image itself, not just the article text. A chart that gets screenshotted needs to carry its own context once it leaves your byline.
One last thing
The single most common radar chart mistake in football journalism isn't a bad metric choice — it's a missing minutes cutoff. A player who logged 400 minutes and a player who logged 2,800 minutes can post similar per-90 numbers by pure variance, and a radar chart makes that variance look like a finding. State the cutoff every time, even when it feels like clutter on the caption.