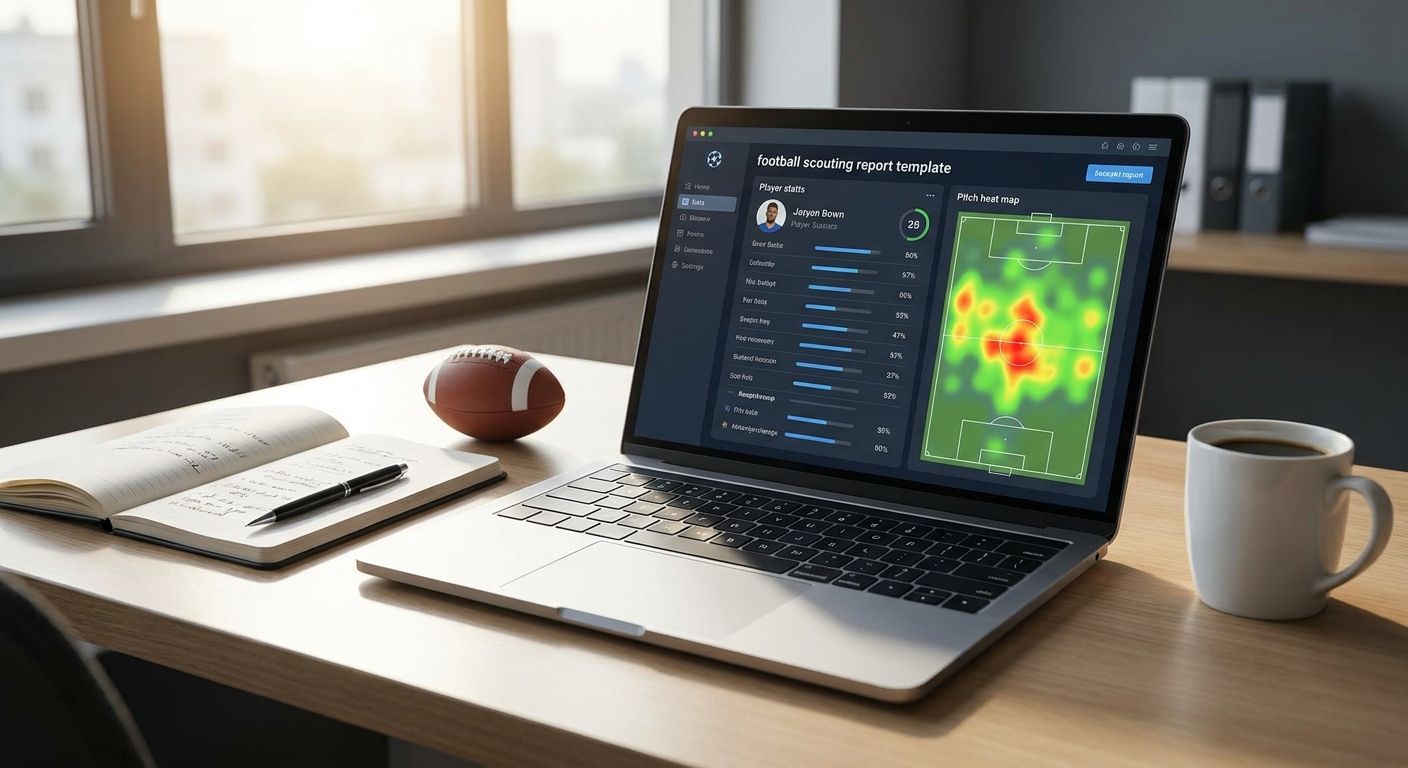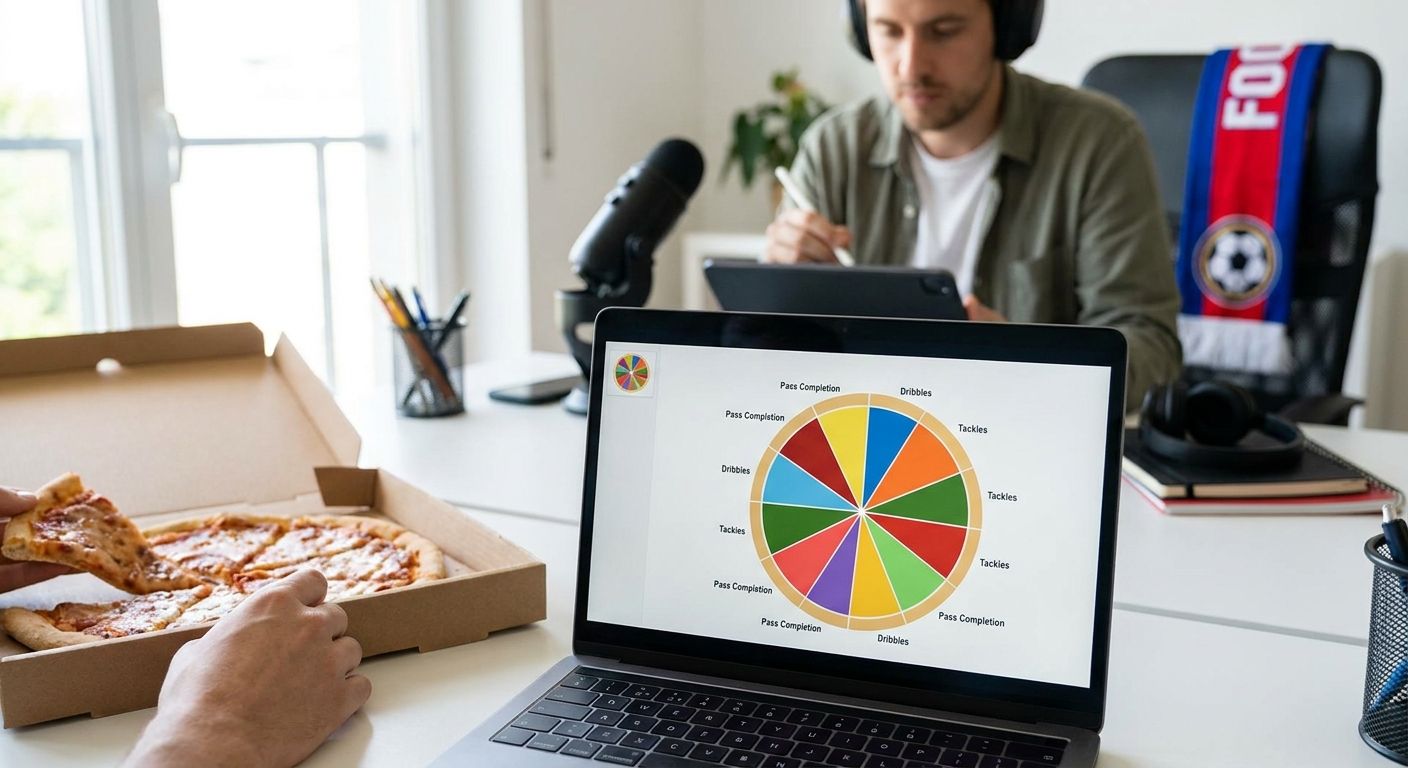
Football content creators live and die by the pizza chart: one glance, one player, one verdict for the timeline. FBPlot builds that chart from real percentile data across 107+ leagues, and this guide tells you which pizza chart format actually earns shares in 2026 and which one gets you quote-tweeted for the wrong reasons.
- FBPlot's Premier League ratings pizza chart is the safest weekly scouting-thread format for 2026 content creators.
- Cross-league comparison charts need adjusted metrics, not raw totals, or transfer takes fall apart under scrutiny.
- Brasileirao and emerging-league pizza charts win engagement on breakout-player content before a transfer confirms it.
- Generic radar templates without a stated population or minutes cutoff are a Skip no matter how clean they look.
- FBPlot's free tier covers the Top 5 leagues; Pro unlocks all 107+ for full pizza chart football content coverage.
Why this matters
A pizza chart is only as credible as the population behind it. Post a radar with no stated minutes cutoff, no season, no role context, and the replies will find the gap before you finish your coffee. Content creators who build pizza chart football content that survives scrutiny treat the chart like a citation, not a sticker.
That matters more in 2026 than it did three seasons ago. Audiences have seen enough bad radars to spot a cherry-picked sample on sight, and a single mislabeled chart can undo months of built trust in a scouting account or newsletter.
Who this is for
This guide is for football scouts, analysts, YouTube presenters, TikTok scouting accounts, and newsletter writers who publish player charts weekly and need a repeatable, defensible format rather than a one-off graphic. If your account posts more than one player breakdown a week, the format decisions below directly affect your engagement and your credibility.
What to look for in pizza charts for content creators
Stated percentile population
Every slice on a pizza chart is a percentile against some group of players. If that group isn't named on the chart, no reader can judge whether the comparison is fair. A chart that states "vs. Premier League forwards, 2026" earns trust that an unlabeled radar never will.
Per-90 normalization
Raw totals reward minutes, not quality. A pizza chart for content creators needs every metric normalized to per-90 or a comparable rate stat, or a bench player with 200 minutes will out-slice a starter every time.
Metrics matched to role
A template built for centre-backs doesn't work for a winger, and vice versa. Progressive passes and pressures matter for a midfielder's chart; shot-stopping and claim percentage matter for a keeper's. Generic five-metric templates flatten the story you're trying to tell.
Reproducibility caption
A one-line caption stating data source, season cutoff, and filters turns a chart into something a reader can check and share without hedging. This is the single habit that separates accounts that get cited by other analysts from accounts that get ignored.
Export quality and branding
A pizza chart shared to Twitter/X, Instagram, or a newsletter needs to read cleanly at thumbnail size and carry your account's look without looking stock. FBPlot's chart export lets you set colours and labels so a pizza chart still reads as yours after five reposts.
League and competition coverage
If your content covers more than the Top 5 European leagues, the tool matters as much as the template. FBPlot's free tier covers the Top 5 leagues; the Pro plan opens all 107+ leagues, which matters the moment your account covers Brasileirao, Super Lig, or MLS breakout stories.
Top picks for pizza chart football content
The scouting staple: Premier League data-based ratings This is the default weekly-thread format and the one most scouting accounts should run first. It uses a stated per-90 population and a role-matched metric set, which is why it holds up under scrutiny better than a stock radar. One spec that matters: the Premier League player ratings build documents its cutoff and filters before the chart ships. Verdict: Buy — run this format for any weekly scouting series in 2026.
The cross-league wildcard: comparing players fairly across competitions Transfer speculation content lives or dies on this format, and it's the one most creators get wrong by comparing raw stats across leagues of different strength. The fix is adjusting for league quality before the pizza chart renders, which is exactly what the cross-league comparison approach does. Verdict: Consider — use it for transfer-window posts, not evergreen content.
The breakout league play: Brasileirao side-by-side Audiences reward early looks at South American talent before a European move confirms it, and this format gives you a defensible chart while the story is still developing. The Brasileirao comparison format is built for exactly this niche-audience play. Verdict: Buy for accounts building a scouting-first following in 2026.
The Champions League buildup Matchday-adjacent content gets a natural engagement lift, and a side-by-side pizza chart timed to a UCL fixture performs well as a pinned post. Treat it as a seasonal format rather than a weekly one. Verdict: Consider — best reserved for group-stage and knockout windows.
The transfer swarm plot When a shortlist has six or more candidates, a scatter or swarm plot communicates the spread better than six separate pizza charts stacked in a thread. It's a supporting format, not a headline one. Verdict: Consider for shortlist posts, not for single-player breakdowns.
“If the percentile population isn't stated on the chart, the chart isn't reproducible, and readers will eventually notice.”
What to avoid
- Unlabeled percentile pools. A radar that doesn't say "vs. which players, which season" looks polished and means nothing under a reply asking for the source.
- Raw counting stats across leagues. Comparing a Bundesliga winger's raw goal count to a Ligue 1 winger's without adjusting for league strength produces a chart that falls apart the moment someone checks minutes played.
- Overloaded slice counts. Twelve metrics on one pizza chart reads as noise, not insight. Six to eight role-relevant metrics communicate faster and share better.
Verdict comparison table
| Format | Best for | Population clarity | Verdict |
|---|---|---|---|
| Premier League ratings pizza | Weekly scouting threads | High — stated minutes and season | Buy |
| Cross-league fair comparison | Transfer speculation posts | Medium — adjusted for league strength | Consider |
| Brasileirao side-by-side | Breakout-player content | High if season is stated | Buy |
| Champions League side-by-side | Matchday buildup posts | High during group stage | Consider |
| Generic unlabeled radar template | Any quick post | Low — no cutoff shown | Skip |
FAQ
What is the best pizza chart tool for football content in 2026?
FBPlot is built specifically for shareable football pizza and radar charts across 107+ leagues, with a free tier covering the Top 5 leagues. It's the direct route for creators who need a repeatable, branded chart format.
Is a pizza chart better than a radar chart for social media?
Pizza charts read faster at thumbnail size because slices are colour-coded and labeled individually, which helps on Twitter/X and Instagram feeds. Radar charts still work better for side-by-side player overlays in longer-form content.
How many metrics should a pizza chart include?
Six to eight role-relevant metrics is the practical range for readability. Beyond that, slices get thin and the chart reads as noise rather than a clear verdict.
Do I need to state the data source on a pizza chart?
Yes — a one-line caption naming the data source, season, and filters is what separates a chart that gets cited from one that gets challenged in the replies. This habit matters more as audiences get more analytics-literate in 2026.
Can I compare players from different leagues on one pizza chart?
You can, but raw stats need adjusting for league strength first, or the comparison won't hold up under scrutiny. A dedicated cross-league comparison approach handles that adjustment before the chart renders.
How much does a pizza chart tool cost?
FBPlot's free tier covers the Top 5 European leagues at no cost. The Pro plan unlocks all 107+ leagues for creators covering competitions beyond the major five.
What's the biggest mistake in football pizza chart content?
Posting a chart without stating the percentile population — no minutes cutoff, no season, no filter list. It looks finished but collapses the moment a reader asks where the numbers came from.
Are swarm or scatter plots better than pizza charts for shortlists?
For six or more candidates, a scatter or swarm plot shows the spread more clearly than stacking multiple pizza charts. Use pizza charts for single-player breakdowns and swarm plots for shortlist comparisons.
One last thing
The accounts that get cited by other analysts in 2026 aren't the ones with the flashiest colours — they're the ones whose charts survive a reply asking "what's the sample?" Build the caption habit before you build the follower count, and the pizza chart football content that lasts will follow.