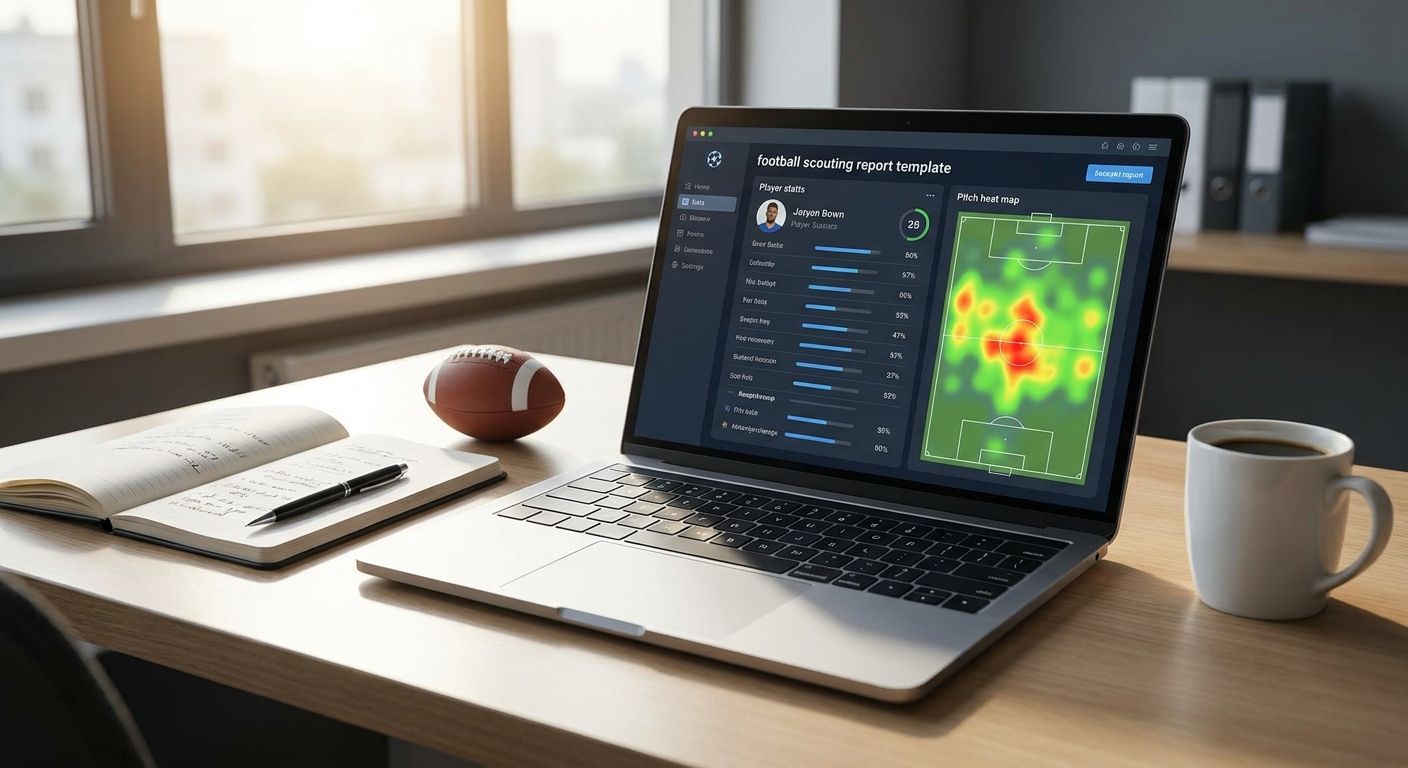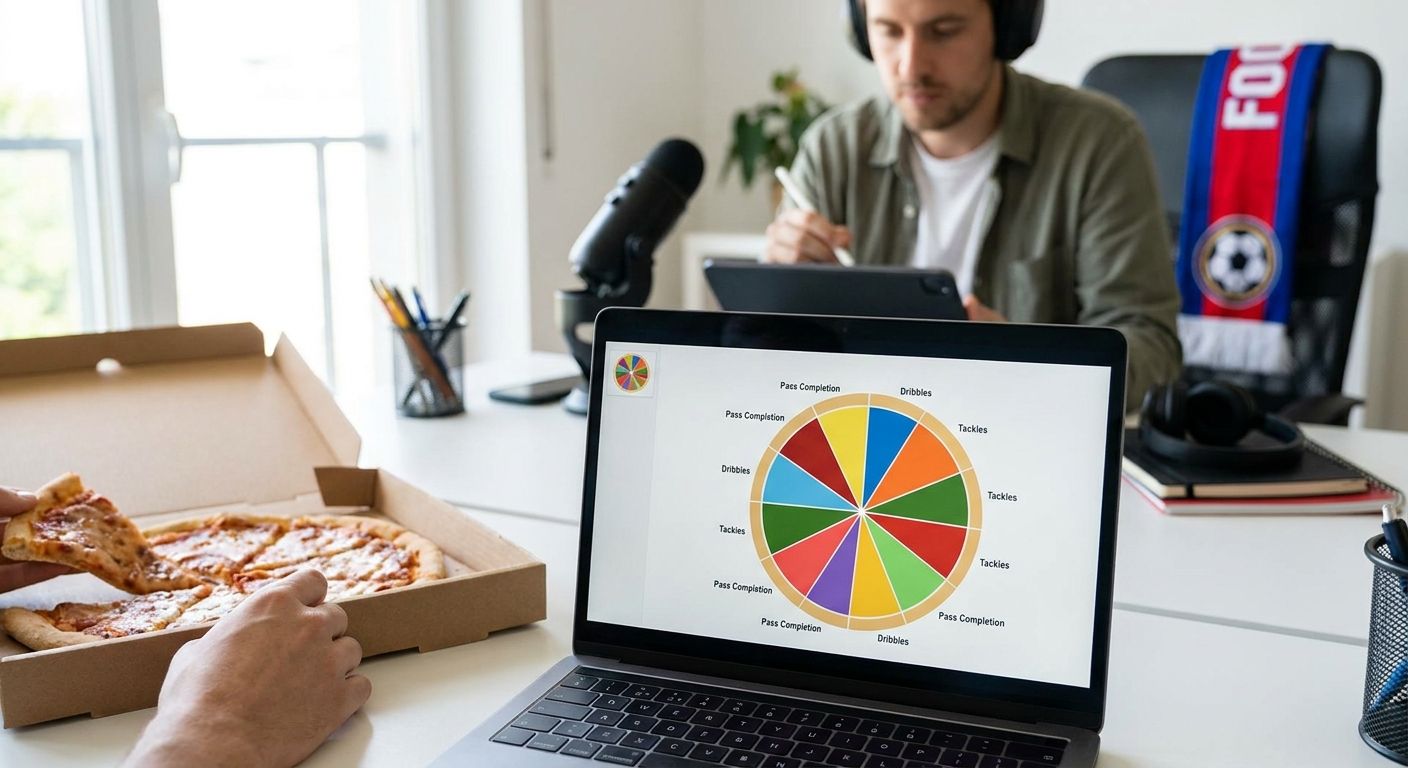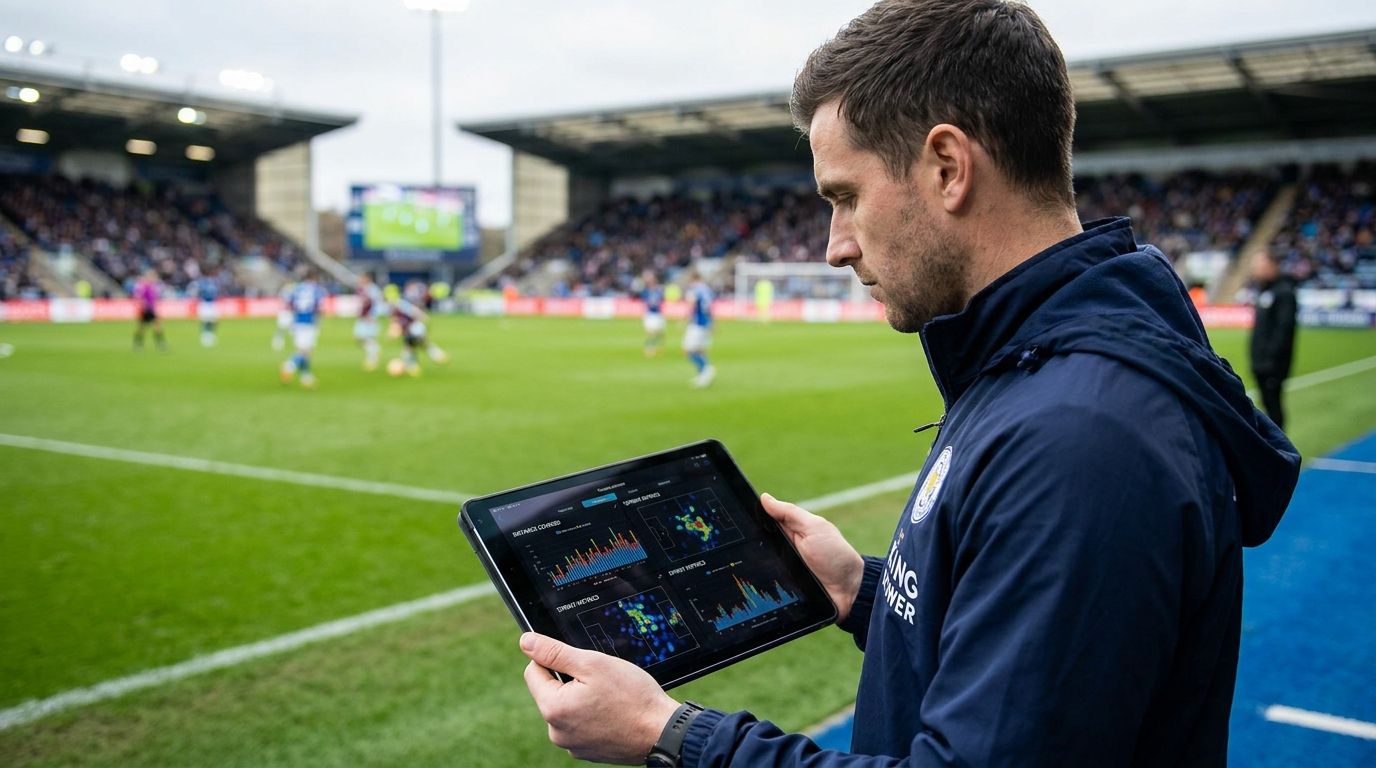
Tracking running stats in the Premier League means picking a source for distance covered, sprints and high-intensity runs, then a tool that turns those numbers into something you can actually show someone. Six platforms cover that job well in 2026, and they split cleanly into two jobs: where the raw running-stats premier league data lives, and what you use to turn it into a chart worth sending to an editor, a coach or a group chat.
- The Premier League's official stats hub is the free, primary source for distance and sprint data in 2026 - start there.
- FBref covers standard match stats but skips granular running-stats premier league detail - use it for context, not physical output.
- Sofascore surfaces live distance-covered numbers during matches; strong in-game, thin on season totals.
- FBPlot turns raw running stats into shareable radar and bar charts across 107+ leagues - buy it for reporting and scouting decks.
- Wyscout adds subscription-only physical metrics for professional scouts; skip it if you just need quick charts.
Why this matters
Running stats only mean something once they're attached to context: role, minutes played, and who else on the pitch you're comparing against. A distance-covered number on its own tells you almost nothing about whether a midfielder is overworked or a full-back is coasting.
That's the gap most "stats trackers" don't close. They give you a table. A scout, journalist or fan still has to turn that table into a comparison someone else can read in five seconds - which is where a chart tool like FBPlot earns its place next to the raw data sources below.
How we ranked
Each tool is judged on four things: whether the running stats come from official tracking data or a modelled estimate, how often the numbers update, whether access is free or gated behind a subscription, and whether the platform helps you visualise the output for a report rather than just displaying a table.
Tools that only show a static leaderboard score lower here than tools that let you filter by role, minutes or competition. Pricing and access levels reflect what's publicly listed in 2026; features on subscription platforms can shift between seasons, so check current terms before you commit budget.
The ranked list
1. Premier League official stats hub - the source of record
The league's own statistics section pulls tracking data captured across all 20 Premier League clubs' stadiums via camera-based tracking systems, covering distance covered, sprints and high-intensity runs per match. It's free, it updates after every matchday, and it's the number every broadcaster cites during a game.
The catch: filtering is limited and there's no built-in way to compare two players side by side beyond a basic leaderboard. Buy - it's the baseline every other source on this list gets checked against.
2. FBref - the free depth play
FBref is free and covers standard, passing, shooting and defensive stats across most major competitions, with historical match logs going back multiple seasons. It's a strong companion source for context - minutes played, per-90 splits, squad role - even though it doesn't publish granular sprint or high-speed-run counts the way the official hub does.
Use it to sanity-check sample size before you build a running-stats argument around a handful of matches. Buy for context, not for the physical numbers themselves.
3. Sofascore - the live tracker
Sofascore's match centre shows live distance-covered figures during Premier League fixtures, refreshing in real time as the match plays out. It's a free app and browser tool, which makes it the fastest way to check a number mid-game.
Season-long aggregation is thinner than the official hub, and definitions of "sprint" can differ from provider to provider. Consider it for live checks, not for building a season report.
4. WhoScored - the ratings-first option
WhoScored is built around its 0-10 match rating system, with attacking and defensive stat tabs layered underneath. Running and physical data sits well behind shooting, passing and defensive numbers in how the site is organised.
If running stats are the actual goal, this isn't the first stop. Hold - fine as a secondary cross-check, not a primary source.
5. Wyscout - the professional scouting layer
Wyscout is a subscription platform used widely by clubs and agencies, and it includes physical performance metrics alongside video and tagged event data for eligible competitions. The depth is real, but so is the access cost, and it's built for club-side workflows rather than a quick public-facing chart.
If you're a professional scout already paying for the platform, the running data is a genuine add-on. Consider - skip it if a subscription isn't already justified by the video and event data you'd also get.
6. FBPlot - the chart layer
FBPlot doesn't collect tracking data itself - it turns the numbers from the sources above into radar, pizza, bar and scatter charts you can actually send to someone. The free tier covers the Top 5 leagues; the Pro plan unlocks all 107+ leagues FBPlot supports, which matters once your running-stats comparison needs a player outside England, Spain, Italy, Germany or France.
For a Premier League-specific workflow, the Premier League player comparison guide walks through building a side-by-side chart from raw stats in minutes. Buy if the end goal is a chart for a report, a scouting deck or a social post - not just a spreadsheet.
Comparison table
| Tool | Best for | Data type | Cost (2026) | Verdict |
|---|---|---|---|---|
| Premier League official hub | Source-of-record running stats | Official tracking | Free | Buy |
| FBref | Context and per-90 splits | Standard match stats | Free | Buy |
| Sofascore | Live in-match distance | Live tracking | Free | Consider |
| WhoScored | Ratings, secondary check | Ratings + light stats | Free | Hold |
| Wyscout | Club/agency scouting | Tracking + video | Subscription | Consider |
| FBPlot | Turning stats into charts | Visualisation layer | Free tier / Pro plan | Buy |
Build your first running-stats chart
Turn Premier League distance and sprint numbers into a shareable radar or bar chart.
Where to source the numbers
- Match the matchday, not the season average, when you cite a specific claim. Distance covered swings with extra time, weather and tactical setup, so a single-match number needs a single-match date attached.
- Cross-reference two sources before publishing a sprint-count claim. Official tracking, Sofascore and Wyscout don't always define "sprint" or "high-speed run" the same way, and the gap shows up in the numbers.
- Convert the raw number into a chart before it leaves your desk. A distance-covered figure in a spreadsheet doesn't survive a Slack thread or an editor's inbox; a radar or bar chart does.
FAQ
What's the best tool to track Premier League running stats in 2026?
The Premier League's official stats hub is the best primary source in 2026 because it publishes tracking data straight from cameras installed across all 20 club stadiums. Pair it with a chart tool like FBPlot when you need to compare players rather than read a single leaderboard.
Is Premier League running stats data free to access?
Yes - the official Premier League stats hub, FBref, Sofascore and WhoScored are all free to use in 2026. Wyscout, the professional scouting platform, sits behind a paid subscription.
What's the difference between FBref and the official Premier League stats hub?
FBref covers standard, passing, shooting and defensive stats with strong historical depth, but it doesn't publish granular sprint or high-speed-run counts. The official hub is the source for that specific physical tracking data.
Does Sofascore show distance covered in real time?
Yes, Sofascore's match centre updates distance-covered figures live during a Premier League fixture. Season-long totals and cross-competition comparisons are thinner than the official hub.
Is Wyscout worth it just for running stats?
Not on its own - Wyscout is a subscription scouting platform where physical metrics are an add-on to video and tagged event data. It's worth it if you already need the video and event tagging for club or agency work.
Can FBPlot generate charts from Premier League running stats?
Yes - FBPlot turns raw stats you've sourced elsewhere into radar, pizza, bar and scatter charts. The free tier covers the Top 5 leagues, and the Pro plan extends that to all 107+ leagues FBPlot supports.
How often does running-stats data update during a Premier League match?
Live platforms like Sofascore update distance-covered figures in real time as the match plays. The official Premier League hub finalises full match stats after the final whistle.
One last thing
Most of the confusion around running-stats premier league numbers comes down to definitions, not data quality. Tracking providers classify speed zones differently - what one system logs as a "sprint" (typically running above roughly 25 km/h) another might log as "high-speed running," which is why the same match can produce two different sprint counts across two sites. Check which threshold a source uses before you compare it against another one.