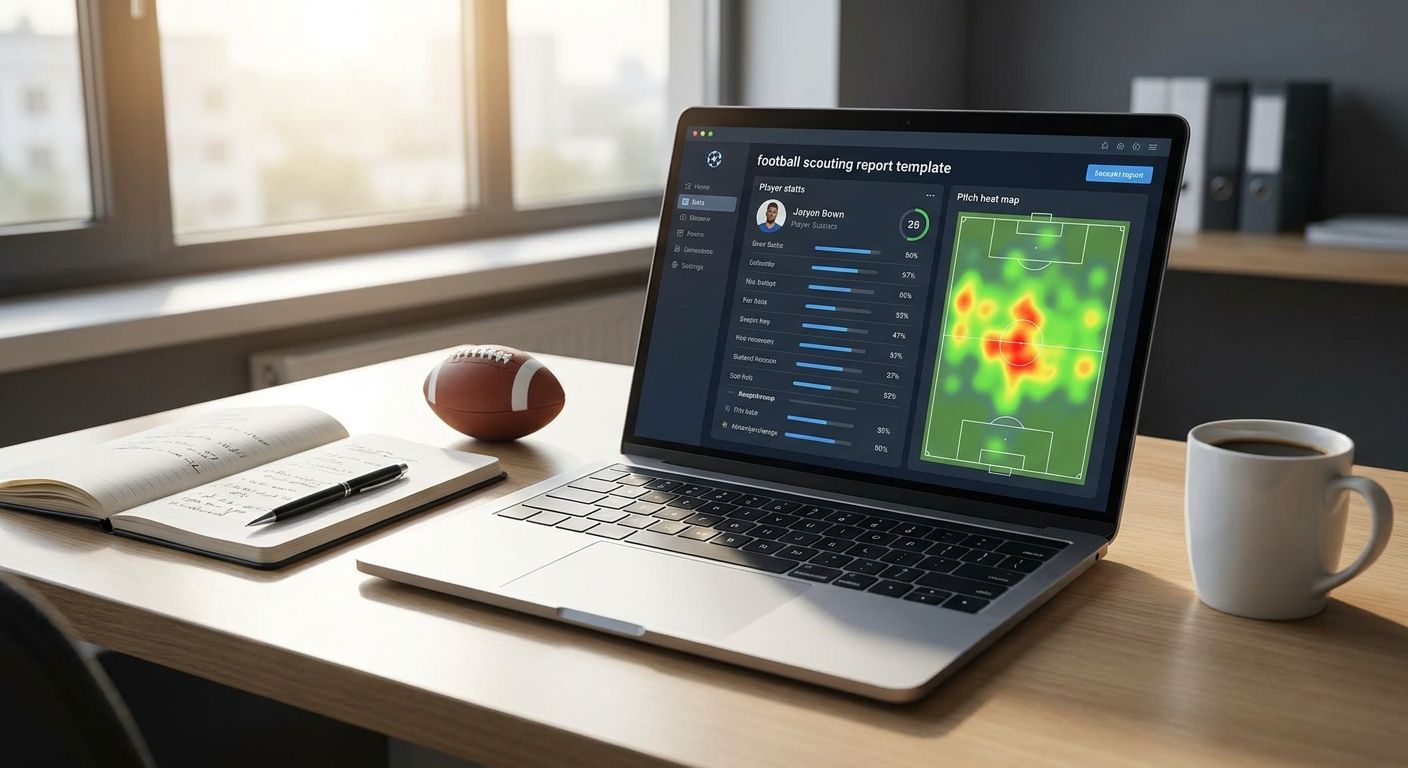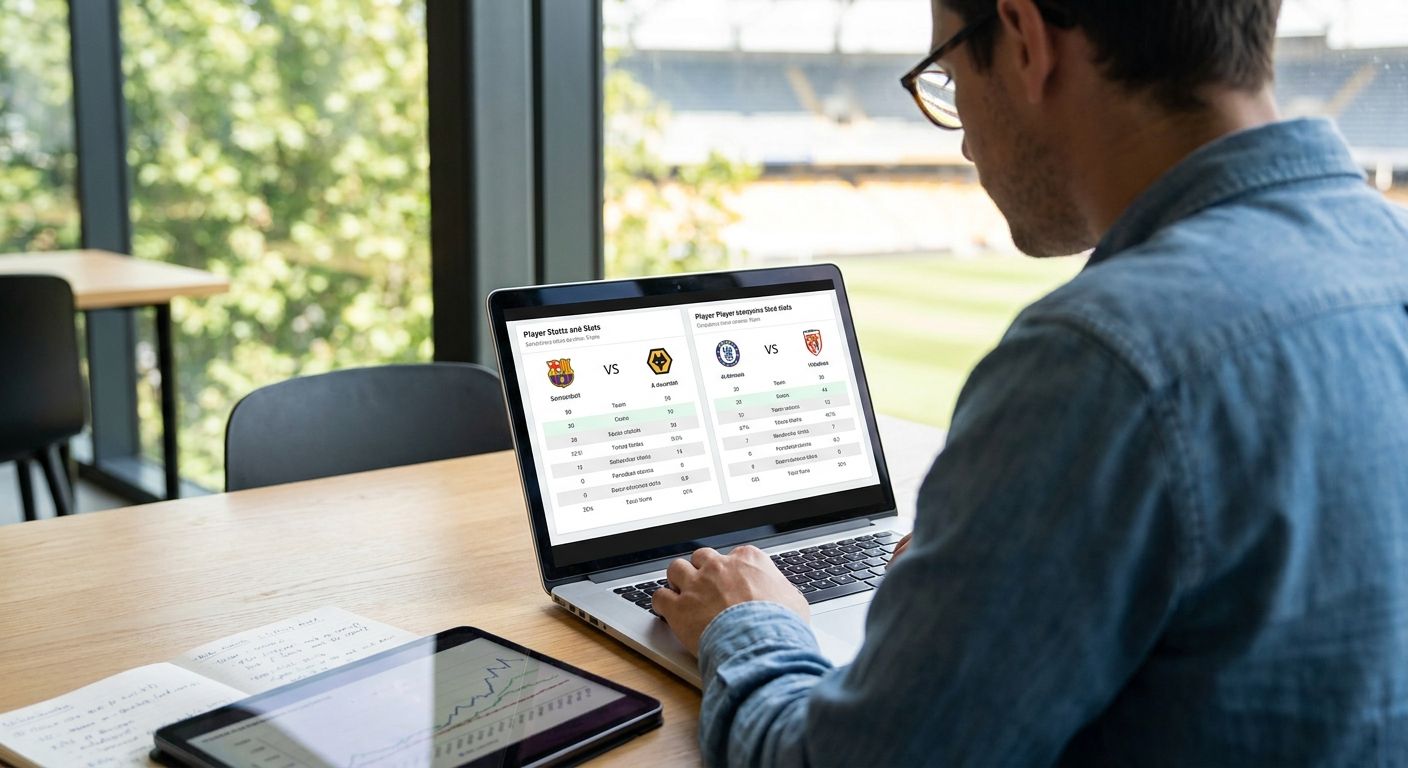
Comparing Brasileirao player stats side by side only gets useful once you fix the population, the per-90 metrics and the chart type before you drag a single name into anything — do that first and the radar or bar chart practically builds itself.
- Brasileirao player stats comparison needs a 900-minute cutoff before 2026 percentiles mean anything — smaller samples swing rankings by double digits.
- FBPlot Pro unlocks all 20 Brasileirao clubs; the free tier only covers the Top 5 European leagues.
- Use a radar or pizza chart for one competition, a bar chart for cross-league per-90 numbers — don't mix the two for the same question.
- Brasileirao runs April to December on the calendar-year format, so match your season cutoff to rounds, not to the August-May window used elsewhere.
Why this matters
Brasileirao gets more scouting and journalist attention every season, and the players who break out mid-year rarely have a full 38-round sample to lean on. A comparison built on raw totals instead of per-90 numbers will make a player who's started 30 matches look better than one who's started 12, even when the second player is producing more per minute on the pitch.
The fix isn't a smarter eyeball test — it's a chart that holds the population, the metrics and the time window constant. Build the comparison in FBPlot once those three are locked, and the visual does the argument for you instead of you doing it in a caption.
What you'll need
- A defined population: position, competition (Serie A only, or cross-league), and season — 2026 Brasileirao, not "this year" loosely defined
- A minutes or matches cutoff — 900 minutes (roughly 10 full matches) is the standard floor before per-90 rates stabilize
- Per-90 or percentile metrics that fit the role — progressive passes and pressures for a midfielder, non-penalty xG and shots per 90 for a forward
- A chart type decision made before you start: radar/pizza for percentile rank within one competition, bar chart for raw per-90 numbers, scatter/swarm for spotting outliers across a squad or league
- A data source with Brasileirao coverage — FBPlot's Pro plan covers Brasileirao alongside 107+ other competitions, since the free tier is scoped to the Top 5 European leagues
- 15-20 minutes of clean build time; rushing the population step is where most comparisons fall apart
The steps
1. Lock the population before you touch a metric
Decide exactly who's eligible: same competition, same season, same broad position group. Comparing a Brasileirao right-back against a Premier League right-back tells you something different than comparing two Brasileirao right-backs, and mixing the two without saying so is how a chart gets misread. Write the population down in one sentence before you open a chart builder — "Brasileirao 2026, centre-backs, 900+ minutes" — and don't touch it once the chart is live.
Common mistake: letting the population drift mid-comparison because a player you want to include falls just under your cutoff, then quietly lowering the cutoff to fit them in.
2. Set a minutes cutoff and stick to it
A 900-minute floor (about 10 full 90s) is a reasonable starting point for Brasileirao because it filters out the small-sample noise that inflates a bench player's per-90 numbers after two good substitute cameos. Below that threshold, a single hot match can move a percentile rank by 10-15 points, which makes the whole chart look more confident than the data supports.
If you're comparing players at 500-899 minutes because the season is young, say so on the chart. A caption that admits the sample is thin is more credible than one that pretends 600 minutes and 2,400 minutes carry equal weight.
Common mistake: applying the cutoff to some players and not others because one name you want in the chart falls just short.
3. Choose per-90 or percentile — not both on the same axis
Per-90 numbers show raw rate: 0.42 xG per 90 is a fact, full stop. Percentile rank shows where that rate sits against a reference group, which only means something if the reference group is stated. Mixing raw per-90 values with percentile ranks on the same radar confuses the reader about what the axis actually measures.
For a Brasileirao-only comparison, percentile against other Brasileirao players in the same position group is the cleaner read. For a Brasileirao player being scouted for a move to Europe, per-90 raw numbers next to a target league's average is more useful — but keep that as a separate chart.
4. Pick the chart type for the question you're actually asking
A radar or pizza chart is built for "how does this player's profile compare across 6-8 metrics at once" — it's the right tool when you're pitching a player's shape, not a single stat. A bar chart is built for "who's ahead on this one number" — cleaner when the argument is a single metric like progressive carries per 90. A scatter or swarm plot is built for "where does this player sit relative to the whole pool" — the right call when you're hunting for outliers across a full squad or league.
Don't force a six-metric radar onto a question that's really just "who scored more goals." That's a bar chart, and a radar for it will bury the answer in five metrics nobody asked about.
5. Build the comparison
With population, cutoff, metric type and chart type fixed, building the chart itself takes minutes, not hours. Pull in 2-4 players for a radar or pizza (more than four and the shape gets unreadable), or a full position group for a bar chart or swarm plot. Keep the metric list to 6-8 for a radar — beyond that, readers stop scanning and start skimming past the outer rings.
6. Label the axes and the population, not just the players
A chart that names the players but not the population invites the wrong read. State the competition, the season, the minutes cutoff and the metric source directly on the chart or in the caption underneath it — "Brasileirao 2026, midfielders, 900+ min, per-90." That single line is what separates a chart someone can cite from one that gets screenshotted and misquoted.
Common mistake: publishing a radar chart with player names and metric labels but no note on season, competition or minutes — the chart becomes unverifiable the moment it leaves your hands.
7. Export and archive the build
Once the comparison looks right, export it and keep a note of the exact filters used to build it. Brasileirao squads change fast during the mid-season transfer window that opens in July, and a chart built in April with April's population won't match one built in August with the same player names but different underlying samples.
Troubleshooting
- The radar looks flat with no standout spikes — you're likely comparing players across different positions. Restrict the population to one role group and rebuild.
- A bench player suddenly looks elite — check minutes. Anything under 900 minutes needs a caveat or exclusion, not a spot on the same chart as a 2,800-minute starter.
- Percentile ranks don't match what you'd expect from watching matches — confirm the reference population. A percentile against all Brasileirao attackers reads very differently than one against Brasileirao attackers at the same club tier.
- Season dates don't line up with a European comparison — Brasileirao runs April to December on the calendar year, not August to May. Comparing "2026 season" data across the two competitions without adjusting for this mismatch will misalign several months of matches.
- Colours clash or players are hard to tell apart — stick to 2-3 distinct colours per chart; a five-player radar in near-identical shades defeats the point of a visual comparison.
- The chart looks fine but nobody trusts it — add the population and cutoff line back in. Most credibility problems in football charts are missing-context problems, not data problems.
Tools and resources
- A data source with confirmed Brasileirao coverage — verify the competition is included before you build, since not every free tool covers it
- FBPlot for radar, pizza, bar and scatter/swarm charts across 107+ leagues, with Pro required for Brasileirao and anything outside the Top 5 European leagues
- A fixed minutes cutoff (900 minutes is a reasonable Brasileirao default) noted alongside every chart you publish
- A one-line population statement for each chart, written before you start building, not after
Build your Brasileirao comparison
Radar, pizza and bar charts across 107+ leagues, including Brasileirao on Pro.
What to do next
The population-first, cutoff-first approach here works the same way for any league. If you're running the same comparison for Premier League players, the Premier League player comparison guide walks through the same steps with Top 5 league specifics — useful if you're building a cross-league chart that puts a Brasileirao name next to a European one.
FAQ
What's the best way to do a Brasileirao player stats comparison?
Fix the population, position group and a 900-minute cutoff first, then build a radar or pizza chart for percentile comparisons or a bar chart for raw per-90 numbers. Skipping the cutoff step is the most common reason comparisons get misread.
Is a radar chart better than a bar chart for comparing Brasileirao players?
A radar chart works better when you're comparing a player's full profile across 6-8 metrics at once; a bar chart works better when the question is about one single number. Use the chart type that matches the question, not the one that looks more advanced.
How many minutes should a Brasileirao player have before including them in a comparison?
900 minutes, roughly 10 full matches, is a reasonable floor for 2026 Brasileirao per-90 comparisons. Below that, a single strong match can swing a percentile rank by 10 points or more.
Does FBPlot cover Brasileirao player data?
Yes, FBPlot's Pro plan covers Brasileirao alongside 107+ other competitions; the free tier is limited to the Top 5 European leagues.
Can I compare a Brasileirao player against a Premier League player on the same chart?
Yes, but adjust for the calendar mismatch first — Brasileirao runs April to December while the Premier League runs August to May, so "2026 season" means different match windows in each competition.
What metrics matter most for comparing Brasileirao forwards?
Non-penalty xG per 90, shots per 90 and touches in the box per 90 are the core set for forwards. Add progressive carries if you're also assessing build-up contribution.
How often does the Brasileirao mid-season transfer window affect player samples?
The window typically opens in July, which is mid-season for Brasileirao's April-to-December calendar. A comparison built before the window may not reflect a player's role after a July move, so re-check minutes and role after that point.
Why does my Brasileirao radar chart look unreadable with too many players?
Radar and pizza charts lose clarity past 4 players layered on one chart. Split larger comparisons into a bar chart or scatter plot instead, which handle a full position group better.
One last thing
Brasileirao Serie A runs 38 rounds across a full calendar year rather than the August-to-May format most European leagues use, which means a "season-long" Brasileirao sample by December can actually be a larger, steadier dataset than a mid-season European one built in December. That's an argument for trusting late-year Brasileirao percentile comparisons more, not less — as long as the 900-minute floor and position grouping are still in place.