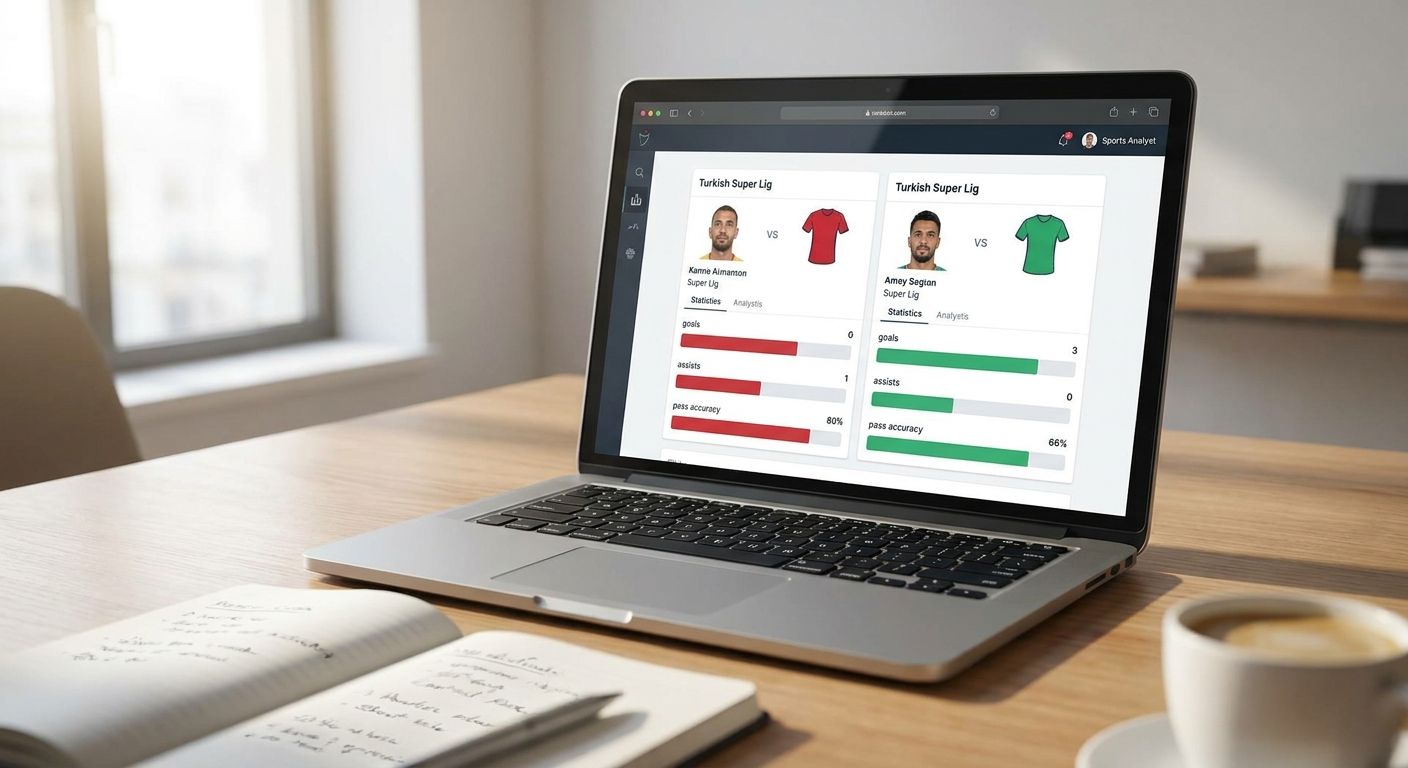
Comparing Süper Lig player stats side by side takes more than pasting two names into a spreadsheet — you need a defined population, metrics that match the role, and a chart type that doesn't flatten the differences you're trying to show. This guide walks through the exact steps for building a Super Lig player stats comparison that holds up when someone else checks your numbers in 2026.
- A Super Lig player stats comparison needs a minutes cutoff — 900+ minutes before percentiles get charted.
- Radar or pizza charts suit role profiles; bar charts suit single-metric rankings; scatter plots suit trade-offs.
- Süper Lig sits outside FBPlot's free Top 5 leagues, so comparing its 18 clubs needs Pro access.
- Label axes, units and the cutoff date on every chart or the comparison isn't reproducible.
Why this matters
Süper Lig has pulled more scouting and journalist attention every transfer window since 2023, and clubs like Galatasaray and Fenerbahçe now show up regularly in European coverage. That attention outpaced the data tooling built around it — most comparison guides are written for the Premier League or La Liga, where coverage is deep and sample sizes are large by midseason.
Süper Lig's 2025/26 season runs 18 clubs through a double round-robin, 34 matches each, so early-season comparisons run on thinner samples than a Big Five league at the same calendar point. FBPlot covers Süper Lig alongside 107+ other competitions, but building a chart that means something takes a few deliberate choices before you drag a single player into a comparison.
What you'll need
- A shortlist of 2-6 players you actually want to compare, not a whole squad
- A defined population: position, league, and season
- A minutes or matches cutoff (900+ minutes is a reasonable floor for Süper Lig midseason)
- Per-90 or percentile metrics that match the players' roles
- A charting tool covering Süper Lig — the free FBPlot tier covers the Top 5 leagues only, so Süper Lig needs the Pro plan
- 10-15 minutes per chart, plus a few minutes to write the caption
The steps
1. Define the comparison question
Decide what the chart needs to answer before touching data: is this "who progresses the ball better," "who's the better finisher," or "who's closer to a Big Five move"? A vague question produces a chart nobody can act on. Write the question down in one sentence — it becomes your caption later.
Common mistake: starting with "compare these two players" instead of "compare these two players on X." Without the X, you'll pick mismatched metrics halfway through.
2. Set the population and minutes cutoff
Pick the exact group the players are being measured against — Süper Lig strikers only, not all of Süper Lig, and not strikers across five leagues unless that's the actual question. Set a minutes floor of at least 900 for the 2025/26 season; below that, per-90 numbers swing on a handful of matches.
This step accomplishes one thing: it stops the chart from comparing a starter's full season against a substitute's six cameo appearances. Expected outcome: a shortlist where every player clears the same bar.
3. Match metrics to role
A winger and a target man shouldn't share the same metric panel. Progressive passes and take-ons matter for a winger; aerial duels won and touches in the box matter for a striker. Pick 5-6 metrics that describe the role, not generic "good player" stats like total touches.
Why it matters: a radar chart with mismatched metrics looks impressive and says nothing — the shape is meaningless if half the axes don't apply to the player's job.
4. Choose per-90 or percentile framing
Per-90 numbers show raw output; percentiles show where a player ranks against the population you set in step 2. For a Süper Lig comparison against Süper Lig peers, percentiles read faster. For a Süper Lig player being benchmarked against Premier League standards, use per-90 so units stay comparable across leagues.
Common mistake: mixing percentile ranks calculated against two different populations on the same chart. If one player's percentile is versus all Süper Lig midfielders and another's is versus all European midfielders, the chart is comparing two different scales that happen to look identical.
5. Pick the chart type
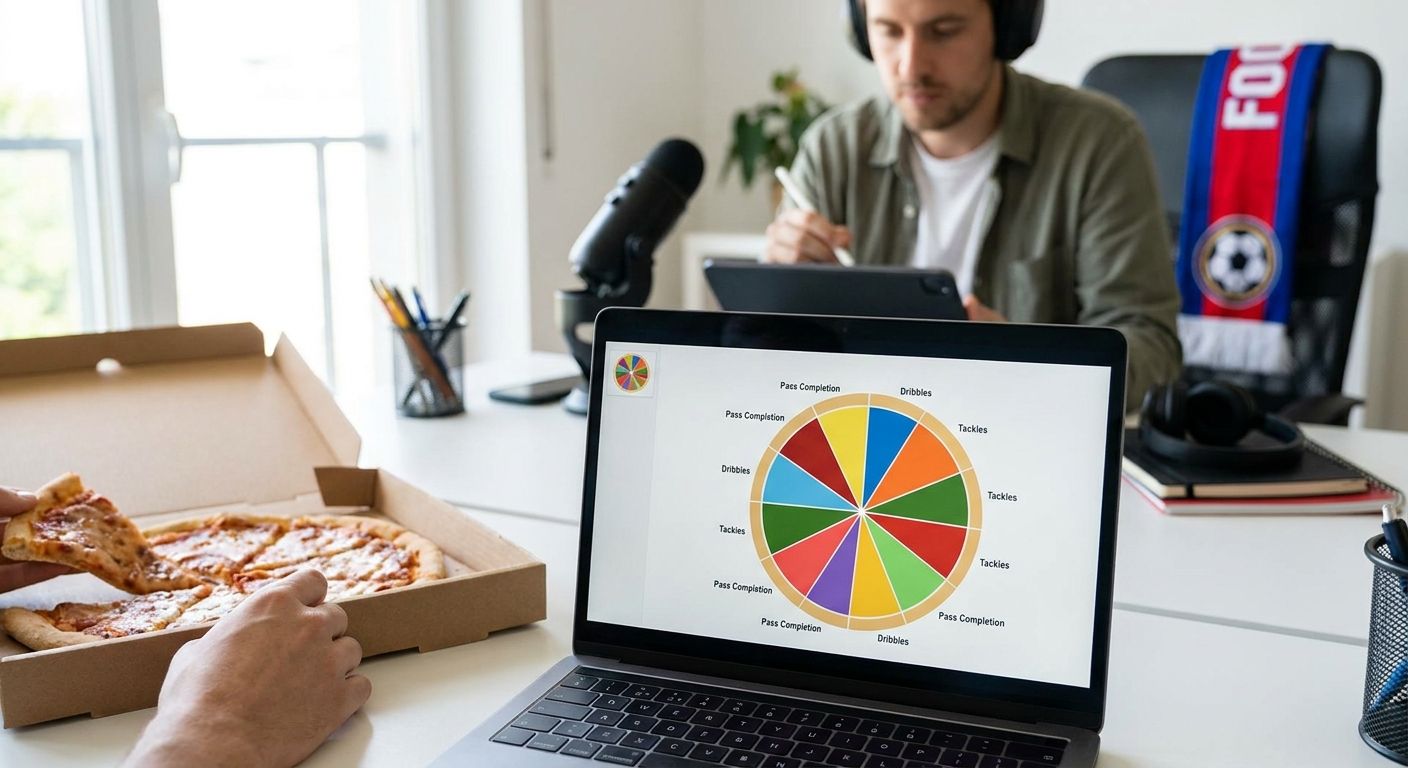
Radar and pizza charts show a full role profile across several metrics at once — best for "how do these two players' games compare." Bar charts rank one metric cleanly — best for "who leads Süper Lig in progressive carries." Scatter or swarm plots show two metrics against each other — best for "who combines volume and efficiency."
Pick one chart type per question. Cramming a ranking and a profile comparison into a single radar chart usually produces something that's hard to read and harder to caption.
6. Build the chart in FBPlot
Select Süper Lig as the league, add your shortlisted players, and choose the metric panel from step 3. Because Süper Lig falls outside the free Top 5 coverage, this step requires FBPlot Pro to unlock the league's full player pool rather than a sample. Generate the radar, pizza, bar, or scatter view and check that every player actually cleared your minutes cutoff before you screenshot anything.
Expected outcome: a chart where every included player meets the same population rules from step 2 — no exceptions for a name you wanted to include.
7. Caption it for reproducibility
Write one caption line stating the season, the minutes cutoff, the population, and the metric units (per-90 or percentile). Anyone reposting the chart should be able to rebuild it from that sentence alone. This is the single habit that separates a chart that gets cited from one that gets picked apart in replies.
If you're comparing Süper Lig output against a Big Five benchmark, the same discipline applies across leagues — the Premier League player stats comparison guide walks through matching populations when the leagues themselves differ in style and pace.
8. Export and share
Export at the resolution your platform needs — full-size for a report, cropped for a social post. Keep the caption attached; a chart without its cutoff date and population note loses credibility the moment someone screenshots it out of context.
Troubleshooting
- A player is missing several metrics. Süper Lig data coverage is thinner than the Big Five in some providers — swap to a metric panel with full coverage rather than leaving blank axes on a radar chart.
- Percentiles look extreme for a player with few matches. Check minutes against your 900-minute floor from step 2; below that, one hot streak inflates a percentile rank.
- Two players in the comparison play different positions. Rebuild the population in step 2 around role, not just league, or split the comparison into two separate charts.
- The radar shape looks lopsided on one axis. Confirm the metric units match — per-90 numbers and raw totals plotted on the same scale distort every axis except the intended one.
- A reader asks how current the data is. This is a caption failure, not a data failure — add the cutoff date from step 7 and the question stops coming up.
Tools and resources
- FBPlot for building the radar, pizza, bar, or scatter chart itself — Süper Lig requires the Pro tier since it sits outside the free Top 5 leagues
- A minutes/matches log for your shortlist, kept next to the chart so the cutoff is verifiable
- The La Liga player stats comparison guide if you're benchmarking a Süper Lig player against a move target in Spain
- A short caption template covering season, population, cutoff, and units — reuse it for every chart so captions stay consistent
Build the comparison in FBPlot
Süper Lig sits in the Pro tier, alongside 107+ leagues total.
What to do next
Once the chart is built and captioned, the next failure point is usually the sample size itself — a strong-looking radar built on 700 minutes reads differently than one built on 1,800. Treat every Süper Lig comparison as provisional until your shortlist clears a full 900-minute floor for the 2025/26 season, and rebuild the chart once more matches accumulate.
FAQ
What's the best chart type for a Super Lig player stats comparison?
Radar or pizza charts work best when comparing a full role profile across several metrics; bar charts work better for ranking a single stat like progressive passes. Pick one chart type per question rather than mixing both on the same visual.
How many minutes should a Süper Lig player have before comparing their stats?
900 minutes is a reasonable floor for midseason 2025/26 comparisons. Below that, per-90 and percentile numbers swing heavily on a handful of matches.
Is Süper Lig covered on FBPlot's free plan?
No. FBPlot's free tier covers the Top 5 leagues only; Süper Lig is part of the 107+ competitions unlocked on the Pro plan.
Should I use per-90 stats or percentiles for a Süper Lig comparison?
Use percentiles when comparing players within Süper Lig itself, since they rank against the same population. Use per-90 numbers when benchmarking a Süper Lig player against a different league, since percentiles calculated against two different populations aren't comparable.
Can I compare a Süper Lig player against a Premier League player directly?
Yes, but use per-90 metrics rather than percentiles, since the two leagues have different populations. Match the metric panel to role first so the comparison isn't distorted by position differences.
What's the most common mistake in a Süper Lig player stats comparison?
Comparing players who haven't cleared the same minutes cutoff, which lets a small sample look statistically stronger than a full-season sample. Set the cutoff before building the chart, not after.
How often should a Süper Lig comparison chart be rebuilt?
Rebuild it as matches accumulate through the 2025/26 season, particularly for players near the 900-minute floor. A chart built in October reads differently once a player has doubled their minutes by February.
Do I need a caption on a Süper Lig stats comparison chart?
Yes. A caption stating the season, population, minutes cutoff, and metric units lets anyone rebuild or verify the chart, and its absence is the most common reason a shared chart gets questioned.
One last thing
The 900-minute floor isn't arbitrary — it's roughly a quarter of a full 34-match Süper Lig season, which is the point where per-90 output stops moving wildly with every additional match. Charts built before that threshold aren't wrong, they're just provisional, and saying so in the caption costs one sentence.